EURUSD Technical Chart | 22-Dec-2011
Below is the technical chart of EURUSD with Ichimoku kinko hyo indicator on H4 time frame.
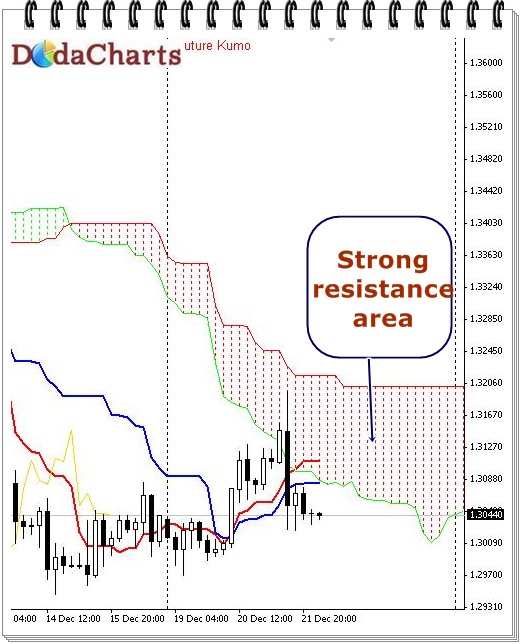
This currency pair is still trading below kumo. So, no hurry to take any buy signal even from your favourite indicator like Doda-Donchian or Doda-Bollinger Bands. Take long position ONLY above kumo as it is a strong resistance area. And below kumo, do not miss any short signal call.
1.3202 is the strong resistance on upside and on downside, I see support at 1.29899.