EURUSD Technical Chart | 24-June-2014

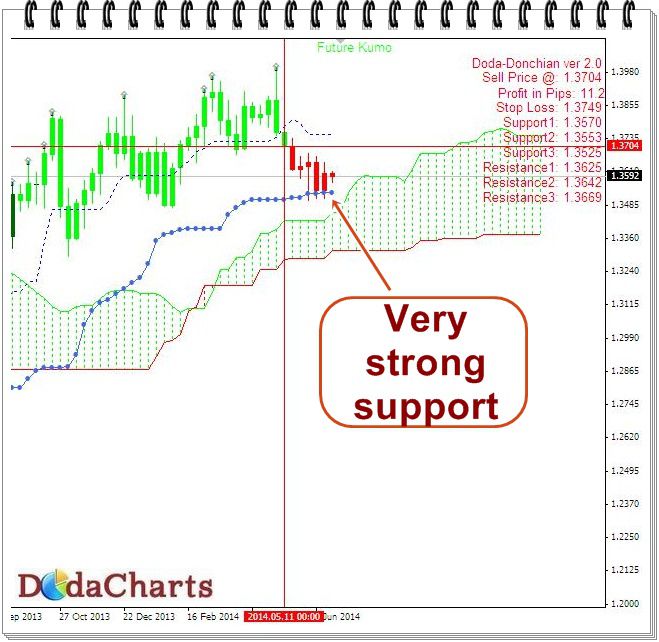
As you can see in the above chart, EURUSD closed below Doda-Donchian line @1.3704 about couple of months back. That was the first sign of its weakness. After that, it took support on Doda-Bollinger Bands 3 times @1.3532. This level is acting as a very support level for EURUSD.
The chart has lost its inheritance strength now. It needs to close above 1.3737 to start fresh uptrend. On the downside, levels of 1.3532 and 1.3361 will act as strong support levels. Below these levels, nothing can stop this currency pair to start BIG downtrend.
So, watch these levels carefully.