Exit Tata Motors | Technical Chart | 21-Mar-2012
Below is the technical chart of Tata Motors, listed on Indian stock exchange, using Ichimoku Kinko Hyo indicator.
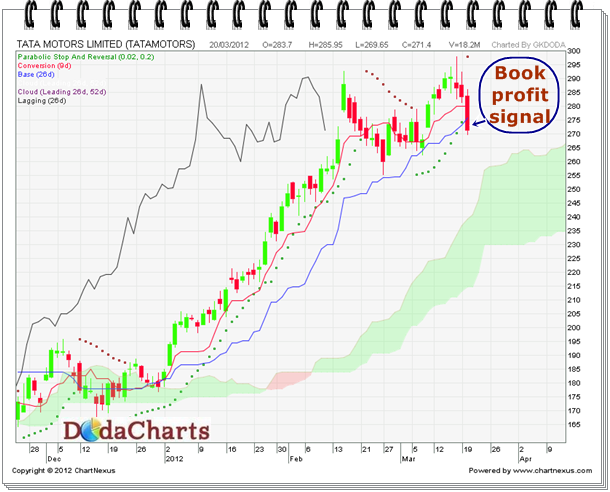 In the last trading session, Tata Motors stock price closed below kijun-sen line @271.40. This is the first signal of its weakness and one should book profits in this stock. On the downside, 263 is the immediate target. On weekly chart, target is 220.40.
Buy again this ONLY when closes above kijun-sen line and not before that.
In the last trading session, Tata Motors stock price closed below kijun-sen line @271.40. This is the first signal of its weakness and one should book profits in this stock. On the downside, 263 is the immediate target. On weekly chart, target is 220.40.
Buy again this ONLY when closes above kijun-sen line and not before that.