FTSE 100 Technical chart | 04-Jan-2012
Below is the technical chart of FTSE 100, using ichimoku Indicator.
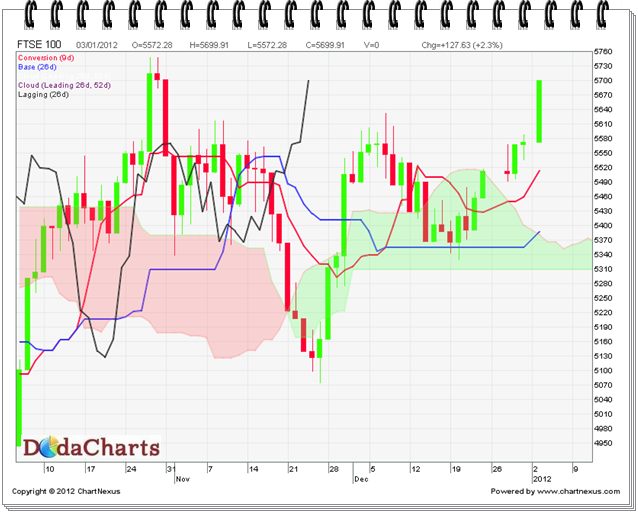
FTSE 100 have crossed kumo, so is the Chikou-Span (CS) line. Both are trading above kumo now. Shows the beginning of new bull run here. So, start buying with a stop loss of 5350 and then 5308.