FTSE 100 technical chart | 19-Oct-2011
From the last few trading sessions, FTSE 100 is trading in side-ways. Below technical chart of FTSE 100 with ichimoku indicator, that will explain everything.
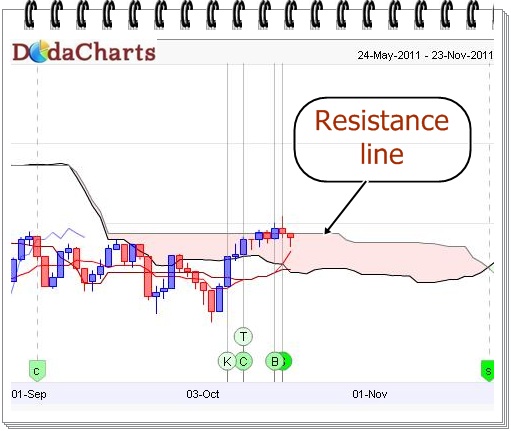
As clearly visible in the above chart, the price is trading near kumo area of Ichimoku indicator. It tried several times to close above this line along with Chikou Span (CS) line, but it failed. That clearly suggests that one should NOT take any long position here till the price along with CS line CLOSES above Kumo – which is the main resistance here. This level is around 5500-6000 zone.