GBPCHF is in major downtrend
![]() I just saw technical chart of GBPCHF currency pair today and amazed to see its continuous downtrend. Sharing its 2 technical charts with you.
I just saw technical chart of GBPCHF currency pair today and amazed to see its continuous downtrend. Sharing its 2 technical charts with you.
The first chart is the daily technical chart of GBPCHF using just 2 indicators viz. Doda-Donchian and Doda-Bollinger.
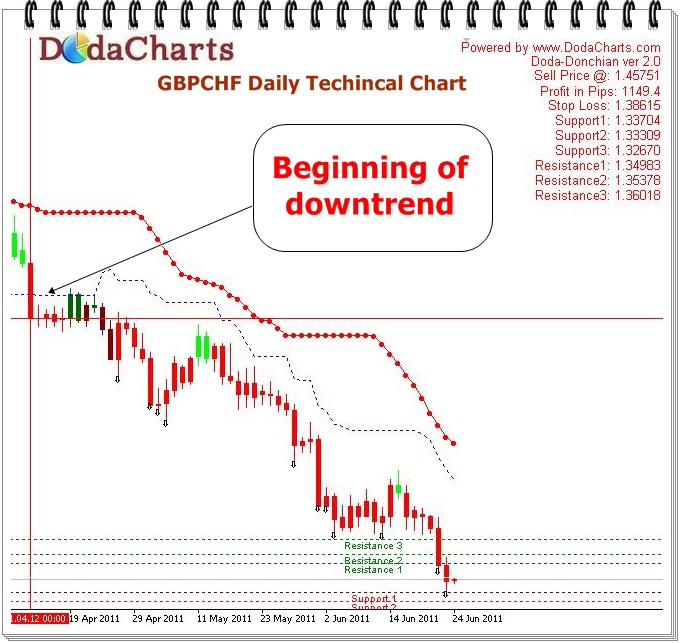
As you can see, Doda-Donchian gave "Sell" signal on 12-Apr-2011 @1.45751. Doda-Bollinger indicator also gave sell signal; infact before few days. And the downtrend started there. From that day, no looking upward. At the time of writing this article, it’s already down by about 1149 pips in just 2 months of time.
Now, let’s look at the monthly chart of the same currency pair.
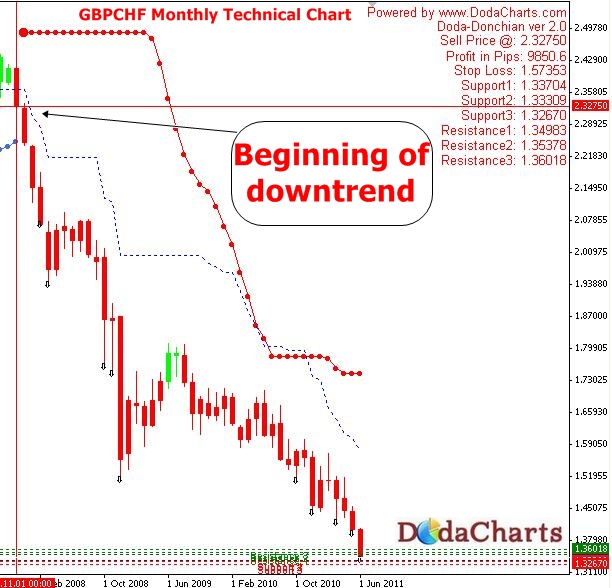
Here again I’ve used the above mentioned 2 indicators. Doda-Donchain and Doda-Bollinger gave sell signal on 1-Nov-2007 @2.3275 and the downtrend did not stop, giving a total pips of 9850. That was a VERY good profit.
So, what’s the point to learn from these 2 charts?
Always see the chart in bigger time frame. That will help you to choose between "Sell calls" and "Buy calls". E.g., in this currency pair, it’s better to take ONLY sell calls and avoid buy calls till we see change in trend in bigger time frame. You might get some profit even in taking buy calls in shorter time frame but that will not be sustainable. On the other hand, your sell calls will fetch more pips as every time frame indicates downtrend. So, don’t miss any sell signal on H4 time frame.