GBPJPY Technical Chart | 19-Oct-2017
Let us discuss GBPJPY technical chart for today.
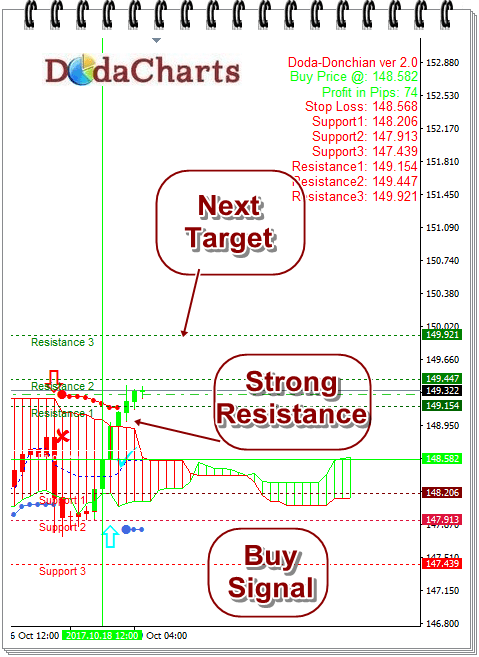
GBPJPY Technical Chart
I’ve used Doda Donchian, Doda-Bollinger Bands, Ichimokuand ADX Candles in this chart. Time frame used is H4.
 GBPJPY Technical Chart
Although Doda Donchian indicator gave Buy signal @148.582 but long call was not initiated. There were several reasons for that.
Firstly, the currency pair was trading inside Kumo cloud of Ichimoku indicator, which is NO trade zone. It's always risky to take any call inside kumo. So, it's better to avoid such signals.
Secondly, the signal was not confirmed by Doda-Bollinger Bands. You can read how to filter out false signals of Doda-Donchian with Doda-Bollinger Bands.
So, the wait was only wise decision.
Now, the currency pair has crossed ABOVE Kumo cloud, which was its strong resistance. Doda-Bollinger bands have also given buy signal.
So, one can easily take long call @149.282 with the target of 149.921. One interesting thing to note here is Future Kumo is also bullish, which is a positive sign.
Major Support Levels:
148.206
147.913
147.439
Major Resistance Levels:
149.154
149.447
149.921