GBPUSD Technical Chart Explained | 25-Oct-2017
Below is the GBPUSD Technical Chart currency pair of 25-Oct-2017 explained with different technical indicators.
GBPUSD Technical Chart
I’ve used Doda Donchian, Doda-Bollinger Bands, Ichimoku and ADX Candles in this chart. Time frame used is H4.
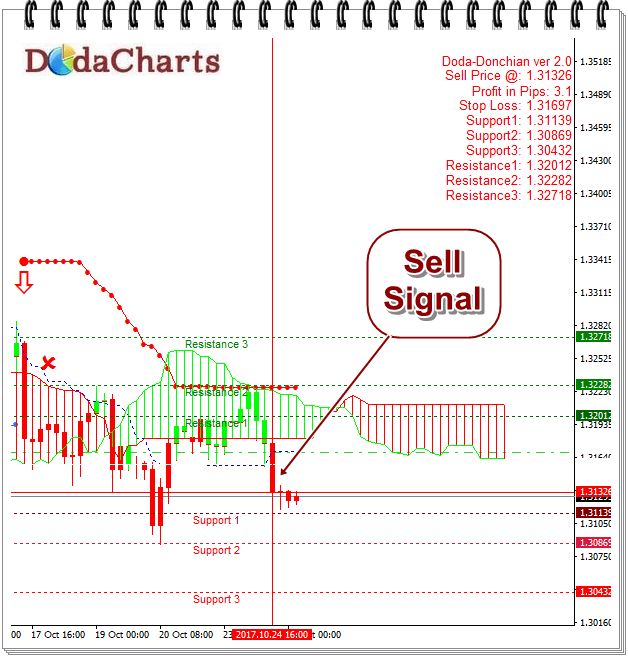
GBPUSD tried to cross 1.32718 but faced tough resistance there from Ichimoku Kumo cloud and Doda Bollinger Bands. So, it moved downward and Doda Donchian gave Sell signal @1.31326. Doda Bollinger bands also confirmed that.
However, after giving a sell signal, the candle pattern shows "Bullish Hammer". So, all the mixed signals will make this currency pair to move sideways for some time. The overall environment is bearish for GBPUSD. So, it will fall further then.
One can take short sell call on GBPUSD now with a stop-loss of 1.31697.
Major Support levels are:
1.31139
1.30869
1.30432
Major Resistance levels are:
1.32012
1.32282
1.32718