GBPUSD Technical chart updated | 03-Sep-2011
 Here is GBPUSD latest technical chart on time frame H4 with indicators Doda-Donchian, Doda-Bands and bbsqueeze dark.
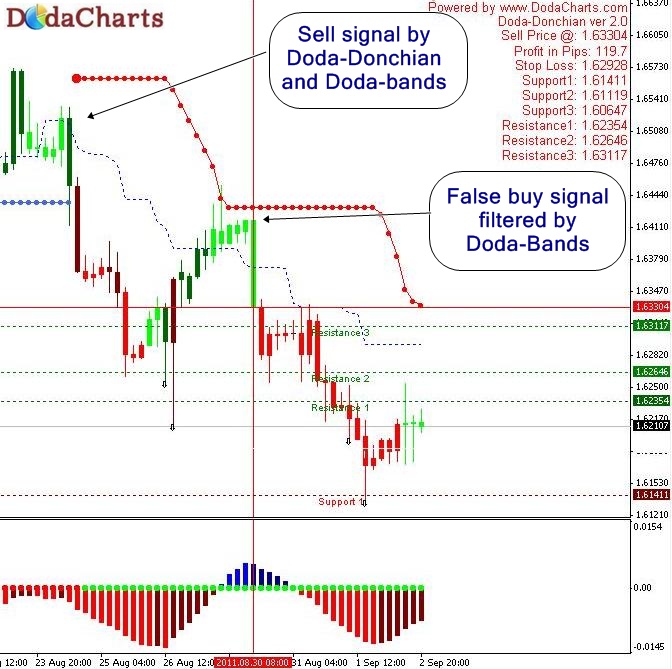
The main point to look at this chart is that around 24th Aug 2011, Doda-Donchian and Doda-Bands gave sell signal. But after few days, the price moved upward and Doda-Donchian gave buy signal. As I’ve already explained in one of my previous posts, that to filter false signals of Doda-Donchain, one MUST look at Doda-bands also.
On buy signal given by Doda-Donchian, Doda-bands did not confirm that and it continued with its previous sell signal. Infact, that was false signal given by Doda-Donchian indicator.
The price of GBPUSD moved downside considerable after that.
To summarize, take your long or short positions ONLY when both – Doda-Donchain and Doda-Bands confirmed that.