Gold Technical Chart | 06-Sep-2013
 Below is the technical chart of Gold with Doda-Donchian, Doda-Bollinger bands and ichimoku indicators.
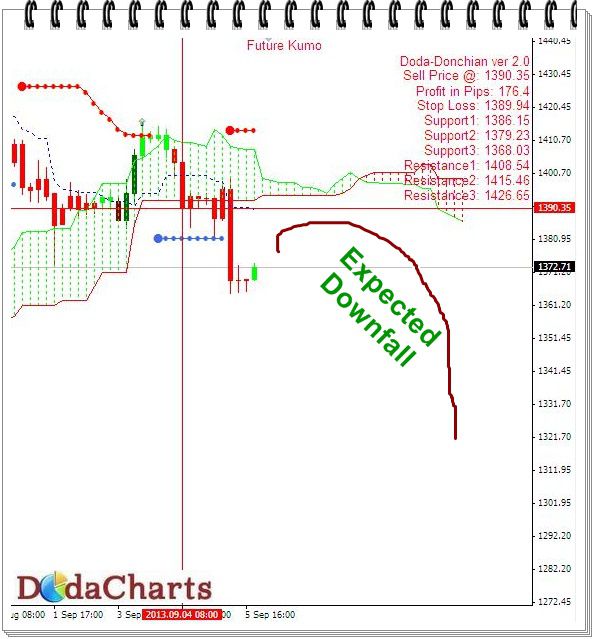
Gold is currently trading around $1371 after getting sell signal from Doda-Donchian @1390.35. Doda-Bollinger bands have also confirmed sell signal. Moreover, price is trading below kumo and future kumo is also bearish.
So, all signals are negative for short term movement of Gold.
Coming to weekly pivotal points, its main resistance for this week is @1399.21. If it closes above this level on H4 time frame chart, take long positions.
On the downside, it has support around $1364.99 and $1339.66.
Keep an eye on Syria event. That can trigger Gold price upward.