Gold Technical Chart | 07-Mar-2012
Below is the technical chart of Gold, on weekly time frame, using Doda-Donchian and ichimoku indicator.
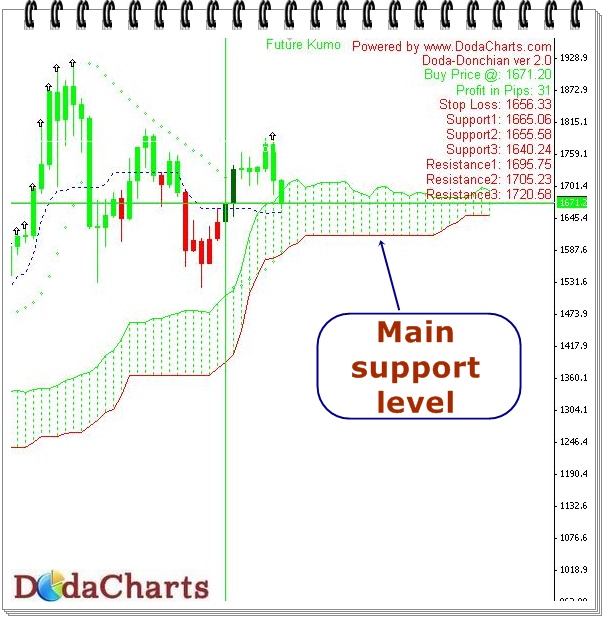
In last few days, we’ve seen many whip-saws in Gold price movement. That’s why I’ve chosen weekly timeframe to analyze technical chart of Gold.
On weekly chart, Gold is trading near its first support level viz. 1656.33. Also, you must note here is that Gold is trading INSIDE kumo, which is no trade zone. On the downside, it must break the levels of 1614.14 to see short selling in Gold. But this is a very STRONG support support of Gold as per its no. of weekly trade zone.