Gold Technical Chart | 09-Oct-2012
Let us discuss the technical chart of Gold on H4 timeframe, using Doda-Donchian indicator.
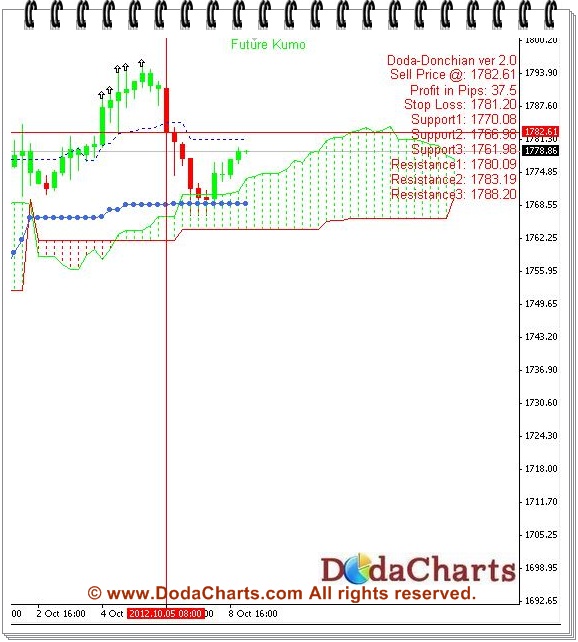
Gold is currently trading @1779.16. It managed to get support around 1769. Now, it will surely break its resistance of 1781.20 – 1781.92. Take only long position in Gold. Its weekly chart is also bullish. Avoid short-selling here.