Gold technical Chart | 13-Dec-2012
 Below is the technical chart of Gold, using Doda-Donchian and Ichimoku indicator.
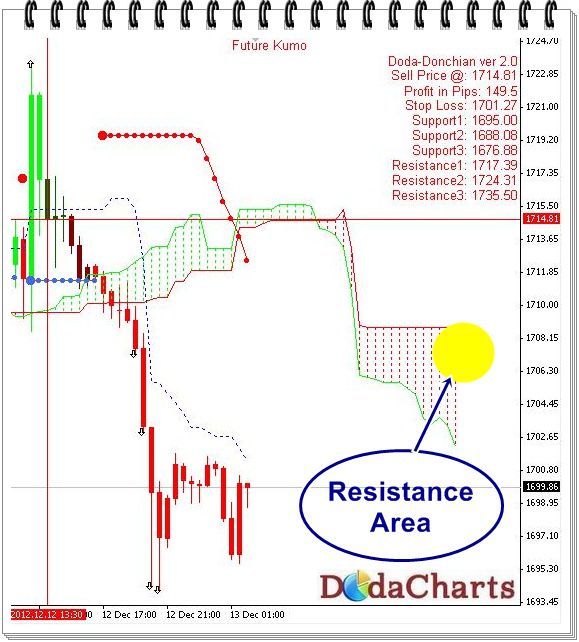
Yesterday, Gold closes below $1703.88 level, which was its major support level of the week. Below this level, Gold is weak and only short-selling calls should be taken. $1696 is the minor support. Breaking it, next target is $1685.39.
Do not take any long position till Gold crosses the major resistance area of $1703-$1708.