Gold Technical Chart | 15-Apr-2013
 Below is the technical chart of Gold using Ichimoku, Doda-Bollinger Bands and Doda-Doncdian indicators. You may download all these 3 indicators freely from the indicators section of this website.
I’ve taken monthly time frame to get view on broader time.
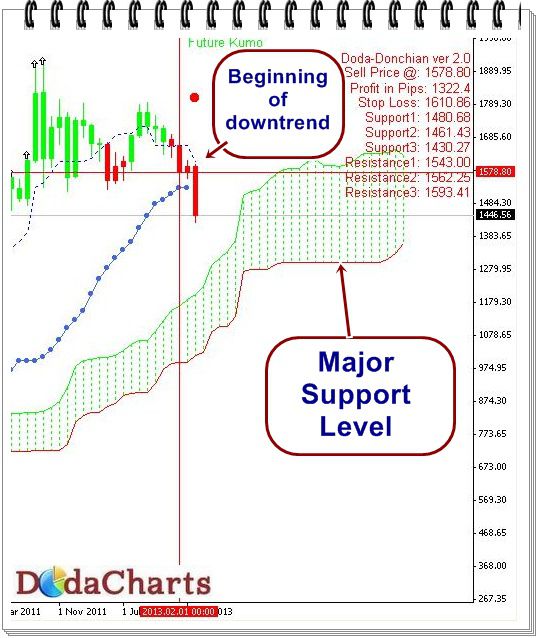
On a monthly chart, Gold was in bull run from the last several years. It was only when it broke the level of 1578.80 on monthly chart, it gave signal of bearish phase.
In the last session, it even broke the level of Doda-Bollinger band viz @1531.48 and fell more than 5%. After such a steep fall, some bounce back can not be ruled out. But the major trend of Gold is still bearish.
Now, the next major support level is of $1300, shown in the chart above.
But if you’re a investor, I would suggest to buy gold on every dips in small quantity. Traders – look at shorter timeframe like H4 and take your positions accordingly with stop-loss.