Gold Technical Chart | 19-Sept-2012
 Below is the technical chart of Gold, using Doda-Donchian, Ichimoku and Doda-Bollinger Bands.
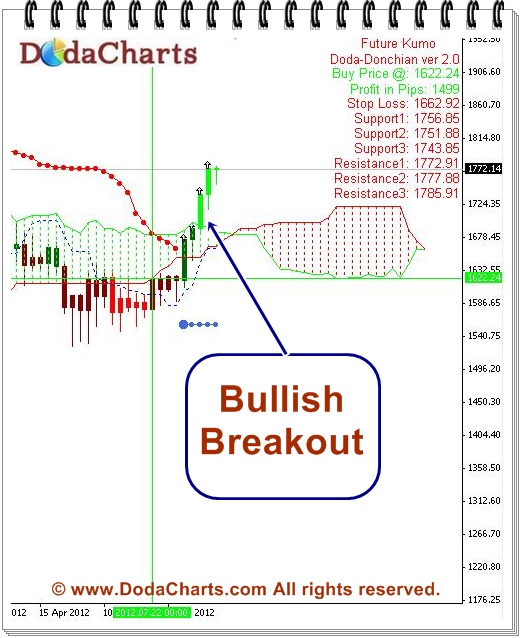
I’ve used weekly time frame in above chart to look for medium-term trend.
Doda-Donchian indicator gave BUY signal @$1622.24. But that was weak signal as the price was trading below Doda-Bollinger Bands and Ichimoku Kumo. So, it had to cross the tough resistance to say breakout.
Then, it closed above kumo @$1738.42; confirmed by Doda-Bbands. And there it gave bullish breakout.
It is a clear buy now. Buy Gold even on dips.
Some support levels: 1764.5767, 1755.49