Gold Technical Chart | 20-June-2014

In such disrupted market conditions, Gold is always considered to be safe heaven. Investors either sit on cash or park their money in Gold. The logic is simple. If stock market crashes, Gold price will increase. Well, not always; but many times – yes.
In this article, we’ll look at technical aspects of Gold chart and look at some of the best price to enter it with stop-loss.
I’ve used Ichimoku, Doda-Donchian and Doda-Bollinger band indicators.
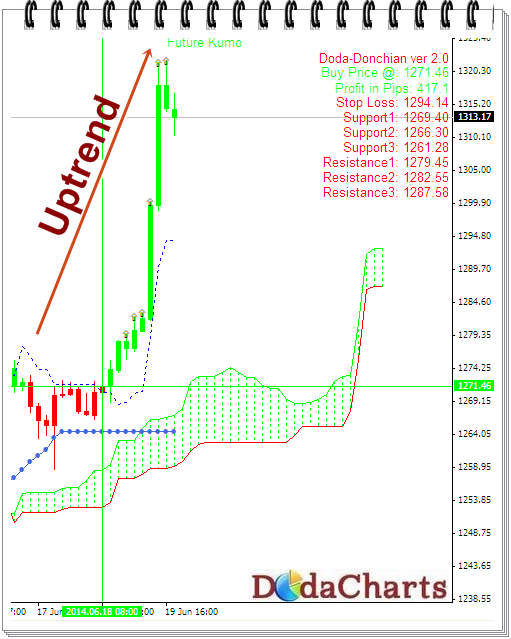
In the last trading session, Gold has started a new uptrend after it manages to cross and close above 1270.58. That was the first buy signal given by Doda-Donchian indicator, confirmed by Doda-Bollinger Bands. 1272.11 was weekly pivot point also. Till Gold is trading above this level this week, it will be in BUY territory.
It touched near the major resistance at $1321 and still it is trading near by. After a steep rise, it’s common to stay at these levels for few hours. But the trend is up from here.
So, do NOT take any sell call on Gold here.
1302.72 is a strong support at this level. One can take long position from if Gold prices come near by and sustain it.
Closing above 1322 is also a buy call as it will start another uptrend from there.