Gold Technical Chart | 23-Nov-2012
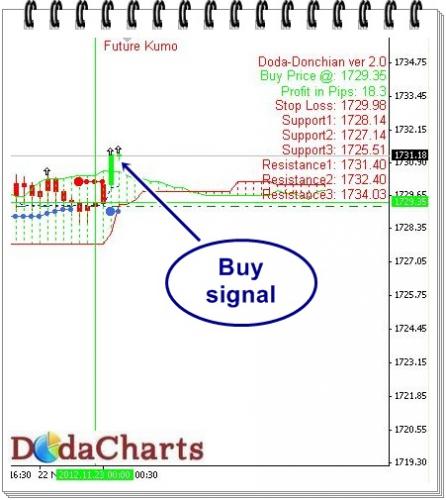
 Just now when I started writing this article, Gold gave a Buy signal. It’s currently trading around $1731 after crossing the resistance of 1730.15. Just take long position here with the stop-loss of $1729.02.
Do not miss any buy signal till Gold is trading above $1721.67 and ignore every short-selling signal.
Here is the technical chart for your ref.