Gold Technical Chart | 25 Dec 2010
Gold is one of the favourite commodity for every investor. Simply because of its liquidity and asset of every country. Let us analyze the technical chart of Gold using Doda Donchian and Ichimoku indicators.
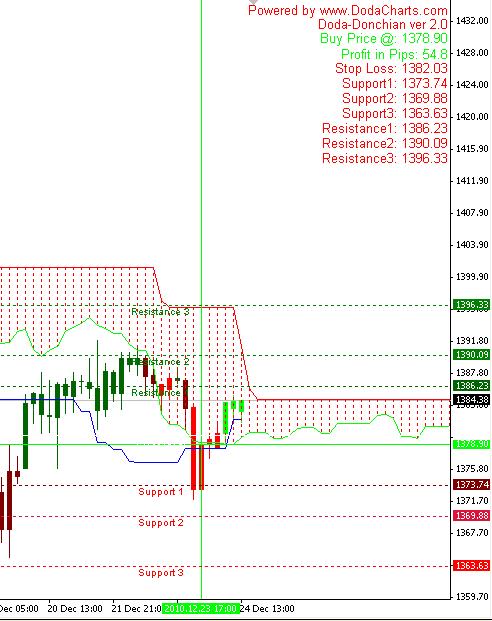
Doda-Donchian gave buy signal @1378.90 just below kumo. Price is now inside kumo. It needs to break 1384.38 to start bull run. Flat line of Senkou Span B confirms that. Whenever the Senkou Span A or Senkou Span B lines are flat, the price gets attracted towards that flat line. Here, the flat line is on upside. So, price will certainly move upwards in coming days.
If you see the daily chart of Gold, the price always find support on Senkou Span A. Isn’t that interesting point?
Share your views in comments section below.