Gold Technical Chart | 25-Jan-2013
 Below is the technical chart of Gold using combination of Doda-Donchian, Doda-Bollinger Bands and Ichimoku indicators.
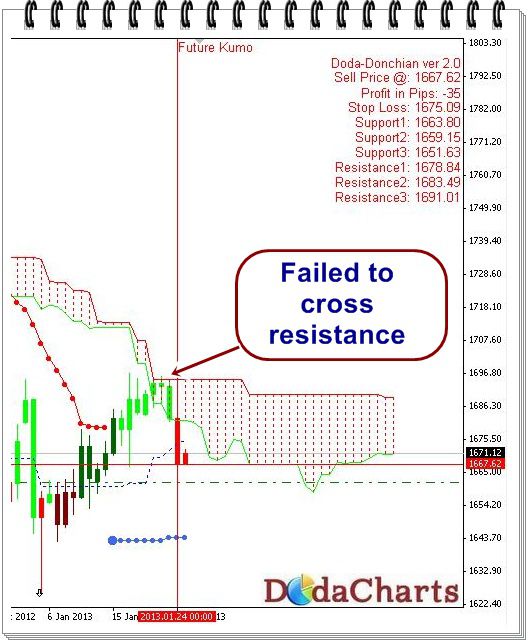
The time frame used is daily in the above chart.
Just few trading sessions back, Gold tried to cross its major resistance of Kumo viz. @1694.86, but it failed there. The trend was already downward and after this failure, it started another leg of downtrend.
Now, it will get support around $1650. After that, the next support level is $1637.
So, DO NOT BUY Gold at this stage. There will be small bull runs but that will run for short time. Don’t get trapped.
Will write another article in the beginning of next week as and when technical charts gives new signals.