Gold Technical chart | 28-Nov-2012
 Below is the snapshot and description on technical chart of Gold using Doda-Donchain, Ichimoku indicators.
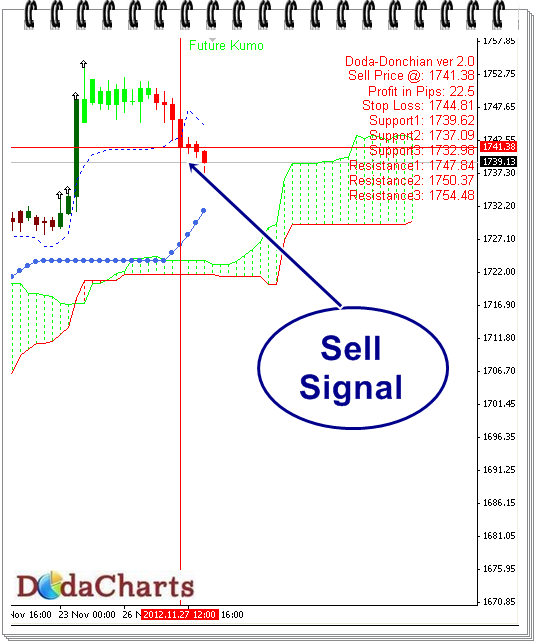
The beginning of this week saw bullish trend in Gold, when it started trading above $1741. But just few hrs. back, it closed below $1741 and has now entered bearish phase. So, cut all your long positions in Gold. Buy it only when it closes above $1741.29.
Support levels: 1737.58 and 1728.36
Resistance :1741.29