Gold technical chart using Ichimoku Kinko Hyo indicator | 10-Oct-2011
Here is the technical chart of Gold using ichimoku indicator this time.
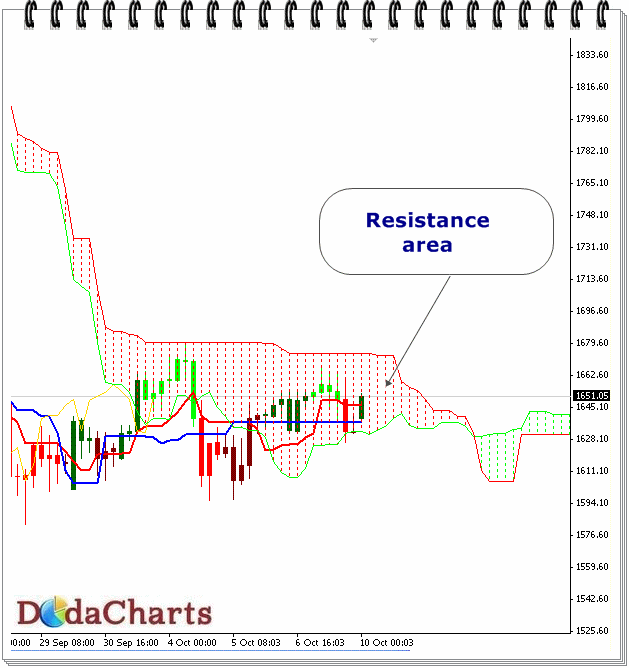
As clearly visible in the above chart, Gold is trading inside kumo – which is a no-trade zone. One should avoid any kind of trading at this stage. Consider it ONLY when the price closes above kumo or below kumo.
The support of Gold is at 1614 for the target of 1704.96 and 1752.05. The main resistance is at 1685.69 and 1692.08.