Gold weekly technical chart | 17-Aug-2012
Below is the technical chart of Gold, using Ichimoku, Doda-Donchian and Doda-Bollinger Bands indicator.
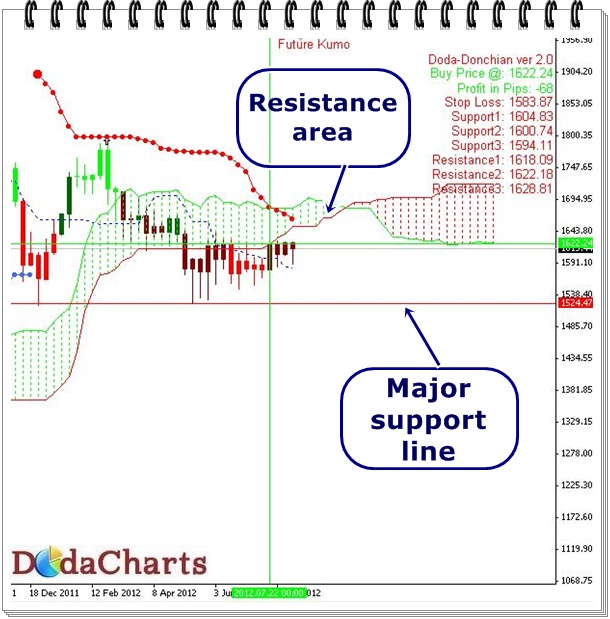
Gold is currently trading around $1615. For medium term trend, we use weekly chart and for long term, we use monthly chart. Above is the weekly chart.
The price of Gold is trading below kumo, which is a sell signal. It is trading below Doda-Bollinger Bnads – again sell signal. The only positive point is that it is trading above Doda-donchian line. All that means, the technical signals are mixed and are not clear. So, one should avoid trading in Gold as of now.
Now, the question arises, when to buy or short-sell in Gold. The answer is again in the above chart.
If it closes above kumo and Doda-Boolinger bands i.e. 1691.44, buy it. It will again start its bull run from there.
If it breaks its major support level viz. 1524.47, do short selling at that level.