Guide to Bollinger Bands indicator
Introduction to Bollinger Bands
The bands of Bollinger (the Bollinger Bands, sometimes there is a transcription “Bollinger”) – can be defined as an indicator, similar to moving average envelopes, but based on the current volatility in the market. Unlike the envelopes of moving averages, the Bollinger bands vary not only depending on the direction of the price movement, but also on the nature of this movement (the speed of the price movement).
Bollinger bands provide a statistical assessment of how far short-term traffic can go before it returns to the mainstream.
A measure of volatility in the Bollinger bands is the mean-square deviation (SDE), which in the Western literature is called the Standard Deviation term.
Formula for Bollinger Bands
The indicator consists of three bands:

Central band – is a moving average, which can be simple, weighted, exponential or sliding of another type.


The lower bar represents the moving average – (coefficient x RMS)
The standard deviation (Standard deviation) is calculated by the formula:
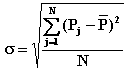
where P is the price of the asset, N is the number of periods for the calculation.
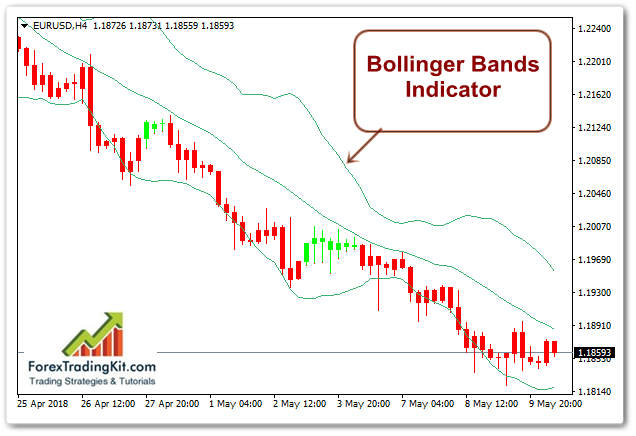
Description of Bollinger Bands
Bollinger bands are formed by three moving averages. In the Bollinger indicator, the distance of the bands from the center line depends on the behavior of the prices. Corridors of the Bollinger indicator strip are called standard deviation corridors, respectively, the bandwidth is proportional to the standard deviation of the price value from the given order of the moving average for the time period under study.
The distance between the bands is determined by the standard deviation of prices, the bands expand when price volatility increases and narrows down when their volatility decreases. If the band narrows, then we see a lateral movement of the market. If the band expands, then we have a directed movement of the market up or down – that is, a trend. On the position of the middle line relative to the price, we make a conclusion about the direction of the market.
Analysis of graphs using the standard deviation corridor of John Bollinger is an independent and original method that allows you to assess the volatility of the market, as well as determine the beginning of strong movements in the market. In combination with other analysis tools, the indicator gives the trader an opportunity to use a wide range of trading strategies.
John Bollinger outlined the following characteristics of his indicator:
- The movement of the price chart from the outside of the bands may signal a continuation of the trend;
- If the ups and downs outside the band are followed by rises and fall inside the strip, a trend reversal is possible;
- Price movement started from one of the borders of the band, strive to reach the opposite strip;
- Sharp price fluctuations usually occur after narrowing the band, corresponding to a decrease in volatility.
- Experience shows that strong price movements occurred after the narrowing of the bands to about the same level.
- Investigations of the indicator on intraday intervals in the stock market showed that in most cases no more than four bars in a row go beyond the Bollinger line, after which a rollback follows. At the end of the formation of the fourth bar, which in a row break through the Bollinger line, it is usually recommended to open a position against the trend;
- Bollinger Bands successfully play the role of lines of support and resistance. It is believed that 95% of the price should be within the formed price band, and 5% – go beyond these lines. The exit of the price from the narrow corridor of the Bollinger band upwards is a signal to buy, down – a signal to sell.
John Bollinger recommends using a coefficient for the RMS of 2.
How to use Bollinger Bands
The most recognized and common are the following trading methods for the Bollinger Bands :
- Trade at the removal of prices from the central line at the time of their confident crossing.
If the price has crossed its central sliding from the bottom up, then there is a purchase, the purpose of which is the level slightly below the upper band. If the price crossed its central moving average from top to bottom, then there is a sale, the goal of which is a level slightly above the lower Bollinger Band.
- Trade at the removal of prices from the central line at the time of their confident crossing.
- Trade vs. exit prices from the strip to the middle.
According to this trading tactic, the position is opened against the movement for the Bollinger Band after a certain time after the breakthrough. After the break of the lower band, a position opens to buy, after the breakout of the upper band, a position for sale opens.
- Trade vs. exit prices from the strip to the middle.
- Another way to use the Bollinger Indicator is to use extreme bands as support and resistance levels. The bands are constructed so that they form support / resistance levels for prices. You can trade from these levels. When approaching the upper level of resistance, you must sell, and when you approach the lower level of support, buy.
The very options for using the indicator depending on the market on which they are used and all of them must be tested before applying them on real money. It must be remembered that the methods themselves were developed long ago for the stock market, and not for the currency markets.
Disadvantages of Bollinger Bands
From the shortcomings of the Bollinger bands, one can distinguish high subjectivity, an insufficient sampling of data when tuning to the recommended orders of means, which underestimates the statistical significance of the data, and at high orders, the sensitivity of the indicator is lost. The author of the method points out the possible inapplicability of the bands in illiquid markets and markets with low activity.