Guide to Ichimoku Kinko Hyo
The indicator Ichimoku (Ichimoku) was originally developed in Japan for use in conjunction with candlestick analysis, because the lack of candlestick analysis at independent of its use, was the inability to efficiently and accurately determine the levels of entry and exit, as well as stops and limits.
Ichimoku designed analyst named Goichi Hosoda (Goichi Hosoda) (pseudonym literature Ichimoku Sanzhdin (of Ichimoku Sanjin)) for the Nikkei index. Ichimoku (Ichimoku) is considered to be a trend indicator(although there are elements of countertrend analysis inside it): it gives good signals in the trend and normal signals (at the level of common oscillators in the Ranj).
Formula of Ichimoku:
Graphically Ichimoku indicator consists of 3 independent lines and two lines, between which the area of the price chart is hatched.
Tenkan-Sen
Tenkan-sen = (Max (High, N) + Min (Low, N)) / 2, where Max (High, N) – Highest of the highs for a period equal to N-intervals (for example, N days)
Min (Low, N), – Minimum minimum for the period equal to N-intervals
N – length of the period
Kinjun-Sen
Kijun-sen = (Max (High, M) + Min (Low, M)) / 2 M is the length of the period
Chinkou Spen
Chinkou Span = Current Close, shifted back to M
Shaded area (cloud) between
Senkou Spen “A”
Senkou Span A = (Tenkan-sen + Kijun-sen), shifted forward by M intervals
Senkou Spen “B”
Senkou Span B = (Max (High, Z) + Min (Low, Z)) / 2, shifted forward by M intervals
Z – length of the interval
The number of parameters – N, M, Z, indicated by the author himself for the use of Ichimoku is 9, 26 and 52, respectively.
These figures are taken from the following relationships:
On the daily chart:
9 – one and a half working weeks, 26 – the number of working days in the month (in Japan there were 6 working days a week), and 52 – the number of weeks in a year.
On a weekly chart:
9 weeks are approximately 2 months, 26 weeks are half a year, 52 weeks is a year.
Description of indicator Ichimoku :
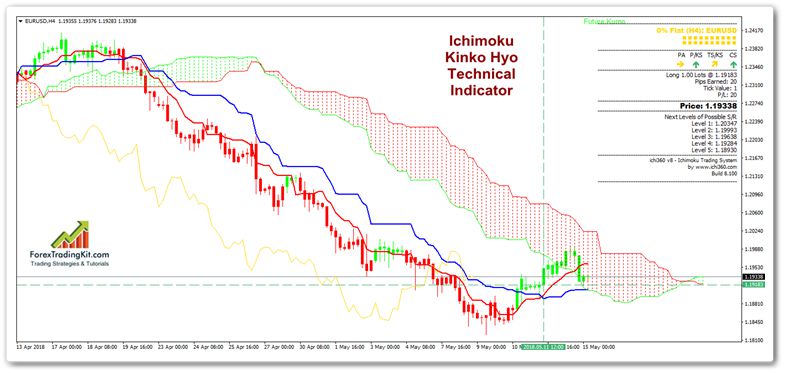
Indicator Ichimoku Kinko Hyo (Ichimoku Kinko Hyo) consists of 5 lines :
Tenkan-Sen (Tenkan-sen-reverse line) is a short-term trend line showing a “fast” trend. Tenkan-Sen points to the current direction of the short-term trend, being the average of the maximum and minimum prices for a long period of time. Accordingly, if it is directed upwards, it means that there is an uptrend in the market if it moves down, it means a descending trend. If the Tenkan-Sen line is parallel to the time axis, then, most likely, the market is now in the state of a flat.
Kinjun-Sen (Kijun-sen – mainline) is a long-term trend line, (usually considered for 26 periods). Shows a longer-term trend, its direction. Interpretation is the same as for a short-term line.
Senkou-Spen “A“, (A Senkou Span – anticipatory line) In general, shows the middle of the distance between Tenkan-Sen and Kindzhun Saint shifted forward by the value of the second time interval. Senkou-Spence “A” is the upper boundary of the cloud, it is believed that it is the line of future resistance and market support.
Senkou-Spen “B” (Senkou Span B – anticipatory line) is calculated as the average of the maximum and minimum prices for the third longer time interval shifted forward by a second time interval Senkou-Spen “B” is the lower limit of cloud Ichimoku, also considered line of future resistance and market support.
The distance between Senkou-Spence “A”, Senkou-Spen “B” is usually hatching, forming a kind of “Ichimoku cloud”.
Chinkou Span (Chinkou Span) is the line of the closing price chart , usually shifted by 26 periods (ie, the second time interval).
How to use Ichimoku
- The most significant signals of Ichimoku include price intersections and Senkou-Spen “B” lines. If the price crosses Senkou-Spen “B” from top to bottom, then a sell signal is sent, from the bottom up to the purchase. This is the signal Ichimoku is strengthened if prices go beyond the boundaries of the Senkou-Spen cloud.
The system is similar to the classical suppression strategy at the price of its moving average.
- The most significant signals of Ichimoku include price intersections and Senkou-Spen “B” lines. If the price crosses Senkou-Spen “B” from top to bottom, then a sell signal is sent, from the bottom up to the purchase. This is the signal Ichimoku is strengthened if prices go beyond the boundaries of the Senkou-Spen cloud.
- Using Ichimoku outside the trend. Ichimoku signals during the market’s flute state arise when prices are inside the Ichimoku cloud. When crossing a short Tenkan-Sen line from below upward to the long line of Kinjun-Sen, a signal is given to buy. Crossing the short Tenkan-Sen line from the top down the long line of Kinjun-Sen is a signal for sale.
- This type of Ichimoku signal is weak if prices are in the cloud. The entry can be made upwards if the prices are at the bottom of the cloud, and down if they are at the top of the cloud. It is assumed that the cloud should be wide enough.
- The system is similar to the classic strategy of crossing two moving averages.
- When Ichimoku is used inside the trading range, it is considered that if prices are in the cloud and Tenkan-sen is directed upwards, then the movement to the upper boundary of the range occurs, if it is down to the bottom, and if it moves parallel to the time axis, the prices stand still. Therefore, the strategy of Ichimoku can be built on the Tenkan-sen turn. When you turn up the buy, when you turn down the sale, if the prices are inside the cloud.
- When the short and medium-term trend lines (Tenkan-Sen and Kinjun-Sen) become parallel to each other and parallel to the Senkou-Spence “B” line, this means the development of a stable trend in the market. It is believed that when price correction and rollback to one of these lines, Ichimoku gives the signal to add to the position or restore the position on the trend. In an upward trend, it is necessary that the top is Tenkan-Sen in the middle of the Kijun-Sen and from the bottom of the Senkou-Spen B, and in the opposite direction, from above Senkou-Spen B in the middle of the Kijun-Sen from below Tenkan-Sen.
- When the price is inside the cloud, if Chinkou-Spen crosses the price from the bottom up, it gives a buy signal. If the Chinkou-Spen crosses the price from above to below, then a signal is given for the sale. At the same time, the author of the technique recommended placing a stop behind the opposite boundary of the cloud. If the purchase is made, then under the lower limit, respectively, for sale above the upper limit. The aim of the trade is the level inside the cloud, which is about 10-20% away from the border, at this level, profit-taking orders are issued. In addition, the position closes and if any return signal is received (if Tenkan-Sen unfolds, if the price chart crosses Chikou-Spen in the opposite direction or the crossing by the price of Senkou-Spen “A” or “B”).
- Senkou-Spen “A” and Senkou-Spen “B”, which were described in the description of the indicator of Ichimoku, respectively, form resistance and support to the market that is inside the cloud. When the market is below the cloud, Senkou-Spen “B” (the lower limit) forms the first resistance, and Senkou-Spence “A” (the upper line) – the second resistance.
- When the price is above the cloud, then Senkou-Spen “A” becomes the first support, and the second is Senkou-Spen “B”
- The independent signal of Ichimoku is the direction of Tenkan-Sen, if it is directed upwards, then there is an uptrend, if down, then downtrend. If in parallel, then flat. Therefore, in some cases, you can enter and exit the market after changing direction Tenkan-Sen.
- The Senkou-Spen “B” line is used to set stop orders.
Note:
- In all cases, the intersection is the intersection of the indicator line and the closing price line.
- As variable parameters, Ishimoku sometimes apply reduced by half, i.e., 5, 13, 26.
- At the forums there are recommendations on the following parameters of Ichimoku :
For graphs from 15 minutes to an hour 15, 60, 120.
For graphs from hours to days 12, 24, 120.
For day charts 9, 26, 52.
- At the forums there are recommendations on the following parameters of Ichimoku :
- It is believed that it works best on charts with a timeframe for more than a day.
- Quite often, the use of input and output signals is combined with other (not Ichimoku- related ) stop and limit techniques (support and resistance, the Fibo line of the trend line of channels, etc.).
Pros of Ichimoku
Ichimoku allows you to separate the trend from the flat with some accuracy . And, as many believe with a high probability to bite off part of the trend.
Ichimoku lines immediately respond to the emergence of new extremes and, accordingly, do not lag as sliding.
Disadvantages of Ichimoku:
There is an opinion that the Ichimoku indicator does not work well here, especially if the flat is narrow.
Additional materials:
There are several practical examples given on DodaCharts.com on how to use Ichimoku with Doda-Donchian effectively.
Codes advisors Ichimoku for Metastock and omega:
advisor code Ichimoku (Ishimoku) for Equis MetaStock (found in the network)
x: = Input ( “period Tenkan-sen”, 0, 500, 9);
y: = Input (“Kijun-sen period”, 0, 500, 26);
z: = Input (“Senkou Span B period”, 0, 500, 52);
ts: = (HHV (H, x) + LLV (L, x)) / 2;
ks: = (HHV (H, y) + LLV (L, y)) / 2;
tsksh: = (ts + ks) / 2;
ssa: = Ref (tsksh, -y);
ssbz: = (HHV (H, z) + LLV (L, z)) / 2;
ssb: = Ref (ssbz, -y);
{If (DayOfWeek () = 1 OR DayOfWeek () = 3 OR DayOfWeek () = 5, ssa, ssb);}
If (Mod (Cum (1), 2) = 1, ssa, ssb);
ts;
ks;
ssa;
ssb;
Strategy code Ichimoku for Omega Research (found on the network)
Cloud
Inputs: Standard (26), Turning (9), Delayed (52);
Variables: Stdline (0), TurnLine (0), Span1 (0), SPan2 (0);
StdLine = (Highest (High, Standard) + Lowest (Low, Standard)) / 2;
TurnLine = (Highest (High, Turning) + Lowest (Low, Turning)) / 2;
Span1 = (StdLine + TurnLine) / 2;
Span2 = (Highest (High, Delayed) + Lowest (Low, Delayed)) / 2;
Plot1 [-Standard] (Span1, “Span1”);
Plot2 [-Standard] (Span2, “Span2”);

Lines.
Inputs: Standard (26), Turning (9), DelayColor (Yellow), ShowDelayLine (False);
Variables: StdLine (0), TurnLine (0), DelayLine (0);
StdLine = (Highest (High, Standard) + Lowest (Low, Standard)) / 2;
TurnLine = (Highest (High, Turning) + Lowest (Low, Turning)) / 2;
DelayLine = Close [Standard];
Plot1 (StdLine, “Standard”);
Plot2 (TurnLine, “Turning”);
If Close> DelayLine Then
SetPlotcolor (2, Blue) Else
SetPlotColor (2, DelayColor);
If ShowDelayLine Then
Plot3 [Standard] (Close, “Delayed”);