Guide to MACD indicator and MACD Histogram
In our previous tutorial on MACD, we’ve learned the basics of MACD. In this tutorial, we’ll try to understand MACD in detail.
Introduction to MACD
The MACD indicator (moving average convergence divergence, which translates as convergence or convergence – the divergence of moving averages) is, on the one hand, classed as oscillators, on the other hand, it can also be referred to the class of complex averages, since it is nothing more than an improved visual the perception of two simple moving averages (or exponential moving averages). It is believed that the MACD indicator significantly reduces the inherent drawbacks of moving averages.
MACD Formula
There are two ways to build and analyze MACD:
- MACD linear, which is more often used for the analysis of the trenches;
- MACD-histogram, by the method of analysis and value rather refers to the class of oscillators.
1. Linear MACD
To calculate the linear MACD from the moving average price (usually an exponential moving average is taken) with a smaller period, an exponential average with a long period is subtracted. In most cases, the result is smoothed using the exponential moving average (EMA) to eliminate random fluctuations.
**MACD = (EMAs (P) -EMAl (P)), **
Signal = EMAa (EMAs (P) -EMAl (P)),
Where:
EMAs (P) – exponential moving average with a long period from the price.
EMAs (P) – exponential moving average with a short period from the price
EMAa (P) – smoothing exponential moving average with a short period from the difference of the other two sliding.
P is the price, the closing price of the Close period is usually taken, but other options are possible (Open, High, Low, Close, Median Price, Typical Price, etc.)
By default, the following MACD settings are usually taken :
EMAs (short) with a period of 12 (two weeks)
EMAl (long) with a period of 26 (month)
EMAa (smoothing difference) with a period of 9
2. The MACD histogram formula
To use the MACD histogram, you need to subtract the signal line from the MACD line.
MACD Histogram = MACD – Signal.
Comments: In modern textbooks on the Internet, and in many new publications, there is a confusion between the descriptions of the MACD indicator and the MACD histogram. The confusion is caused by the same names of the indicator “MACD-histogram” and the way the linear MACD is displayed in the form of a histogram.
The MACD graph
Typically, technical analysis programs such as Metastock, Trade Station, Metatrader, Dealing Desk place the MACD indicator (and a line and histogram on a separate chart) on which the zero line is marked.
Graph of linear MACD
On the schedule are drawn two curves.
**The first MACD = EMA (12) [p] – EMA (26) [p]; **
The second Signal = EMA a (EMA l (P) -EMA s (P)),
In most cases, MACD is drawn in the form of a histogram (it is in the form of a histogram and not a MACD histogram indicator ), and its smoothed moving average (signal line – Signal) is drawn as a line.
The zero line of the MACD indicator shows the level at which the average prices of the two periods are equal, ie, there is a certain equilibrium between the prices of the short and long-term periods.
The MACD yield above the zero level indicates an increase in prices in the short term relative to long-term prices. an upward trend. Accordingly, the output of values below zero means a decrease in prices in the short term relative to the long-term period and, accordingly, a downward trend.
2. Graph of the MACD-histogram
The MACD histogram measures the distance between the MACD line and the signal line. She draws this difference in the form of a histogram – a sequence of vertical columns.
- If the MACD is above the signal line, the value of the MACD histogram is positive and is laid up from the horizontal axis (zero).
- If the MACD is lower than the slow one, then the MACD-histogram has a negative value and is displayed below the horizontal axis.
- When the MACD and signal line intersects, the MACD histogram is 0.
- When the gap between the MACD line and the signal line increases, the MACD histogram becomes wider.
- When two lines approach, the MACD-histogram becomes narrower.
MACD
Signals of linear MACD:
- The appearance of a maximum or a minimum on the signal line means that the signal of the MACD indicator may soon follow and should be prepared for the transaction.
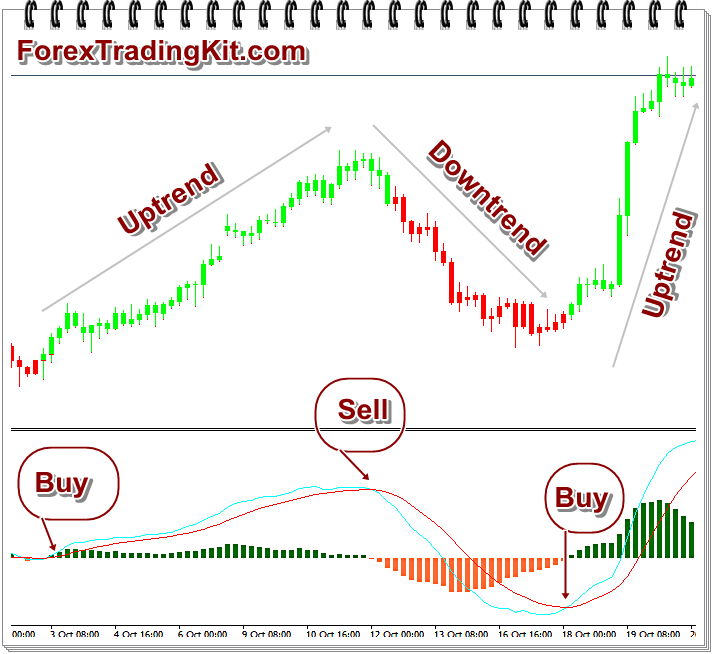
- If the MACD is above the zero line, then in the market an uptrend, respectively, the intersection of the zero-line MACD from the bottom up gives a buy signal. The strength of such a signal depends on what the previous MACD movements were like. If MACD was above the zero line for a long time, and then began to fall crossed the zero line from top to bottom, then this is treated as a sell signal. And if MACD was in the negative zone for several months, then the rise is above zero and then the return below the zero line is most likely indicative of only a temporary correction.
- If the MACD is below the zero line, then in the market a downtrend, respectively, the intersection of the linear zero line MACD from top to bottom gives a sell signal. Here also it matters how long before this MACD was below the zero line.
- When using MACD in divergences, if a Bullish divergence is formed , i.e. a new high on the chart of the price above the previous one, and a new high on the chart the MACD indicator below the previous one, it shows the weakness of the current upward trend and likely soon turn. It is about probability, but not about the spread itself, so do not immediately open a position against the existing upward trend. In such cases, analysts are usually advised to wait for confirmation signals, for example, breaking a trend line or signals from other analysis systems. Bull discrepancy may be poorly confirmed by the intersection of MACDits signal line from top to bottom. Divergences (divergences) are the least frequent of MACD signals, but, as a rule, warn of a possible maximum or minimum price.
- If the Bearish convergence is formed, i.e. a new low on the chart price lower than the previous, and a new low on the chart indicator MACD above the previous one, it shows the weakness of the current downward trend and the market is more likely turn up. However, as in the case of the Bullish divergence, it is not necessary to open positions for purchase without waiting for more weighty evidence of a trend reversal. Bearish convergence may be poorly confirmed by crossing the MACD of its signal line from the bottom up.
- Multiple discrepancies (triple or more Bull Differences and Bear Convergence) are treated as well as usual, with the only difference being that the stronger signals are MACD.
- When the linear MACD itself is below 0 and crosses the signal line from the bottom to the top, then if there is no bearish convergence, the most likely rise in prices.
- When the MACD is above 0 and crosses the signal line from top to bottom, then, if there is no bullish divergence, the most likely drop in prices.
- In the event that the market clearly does not have a trend, reaching a maximum of MACD suggests that short-term prices have deviated significantly from long-term prices – this is a weak sell signal. In the event that MACD designated its minimum, it is a weak signal to buy. The strength of these signals increases if the maximum or minimum was really abnormal, i.e. went beyond the values you see.
- On the MACD as well as in graphical analysis of prices can be used to support line of resistance, and technical analysis of the figures.
MACD-Histogram Signals
Some authors, in particular, A. Elder (Book how to play and win on the stock exchange), believe that the MACD histogram gives a deeper understanding of the balance of power between bulls and bears than the original MACD. Using the MACD-histogram , it gives an opportunity to evaluate not only who is stronger at the moment buyers or sellers, but also the tendency of their strength, how and how quickly the preponderance between them changes.
- The slope of the MACD histogram is not talking about the current preponderance of sellers and buyers, but about how the balance of power is changing: the upward slope suggests that buyers are getting stronger than before (but not necessarily stronger than sellers), and a downward slope indicates that sellers are becoming stronger (but not necessarily that they are already stronger than buyers), so changing the slope is a signal of the MACD histogram . Changing the slope from below with “down” to “up” gives a buy signal. Changing the slope from “up” to “down” gives a sell signal.
- If the market is growing trend, and the slope of the MACD histogram down, it means weakening that the rate of trend growth is gradually decreasing and we need to start looking for points for sale. Conversely, if the downside trend in the forex market and the MACD histogram increases, it means that the rate of falling prices decreases and you need to gradually think about closing positions for sale or thinking about buying.
- In most cases, MACD highs and lows – the histograms very long anticipate the highs and lows of the price, so when such highs and lows appear on the MACD indicator chart, you should prepare for the appropriate action. But it is prepared, and not to make purchases and sales. For example, when a histogram MACD reaches a maximum during a rally, the upward trend in its highest development, and following up to chart the price is likely to be larger than the previous. Accordingly, if the MACD- histogram falls to a new low during a downtrend, then the new minimum price is likely to be lower than the previous one.
- Divergences (Bullish divergence and Bearish convergence) allow you to catch the moments of the main reversals and the beginning of a new trend.
Disadvantages of MACD
- It is believed that both the linear MACD and MACD histogram give too many false signals on intraday charts, and MACD indicators are better used for periods from day to day.
- The MACD line indicator is sometimes significantly delayed when generating trend signals.
- As in most cases, the smaller the MACD setting, the more false signals the indicator gives the more MACD settings, the more signals it misses. Naturally, there are no optimal MACD settings.