Guide to Momentum indicator
The Momentum indicator is one of the most popular oscillators of forex technical analysis showing the rate of price change, or in other words, the rate of price change, being one of the simplest and most effective tools of technical analysis.
Formula of Momentum indicator
Momentum Simple = C – Cn
Where C is the closing price of the current period.
Where C-n is the closing price of N periods back.
Note: in modern textbooks there is a disagreement about the formulas Momentum. The above formula is taken from Murphy’s “Technical analysis of futures markets” and most likely it is the right one.
There is another variation in calculating the indicator Momentum from the book Akelis. Technical analysis from A to Z, in which Momentum coincides with Rate of Change and the formula is used:
Where C is the closing price of the current period
Where C-n is the closing price of N periods back.
Unfortunately, this formula in its time migrated to many technical analysis programs.
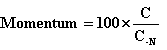
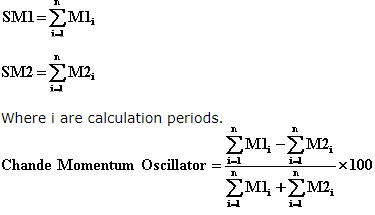
There is also a separate formula called Chande Momentum Oscillator (CMO)
Chande Momentum Oscillator is calculated as follows:
MomentumSimple = C-C-1 Where C is the closing price of the current period
Where C-1 is the closing price of the previous period.
If MomentumSimple> 0, then M1 = MomentumSimple, and M2 = 0;
If MomentumSimple <0, then M2 = -MomentumSimple, and M1 = 0;
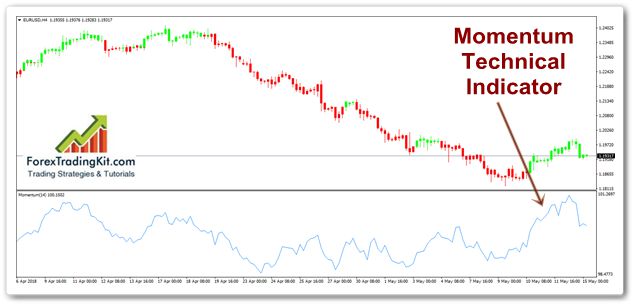
Description of Momentum indicator
Momentum (Momentum) is the simplest trend indicator. Its formula is so simple and intuitive that it does not require a description. Exceeding the current closing prices over the past, shows an uptrend, and if the current prices are lower than the past for the selected time interval, this means a downtrend.
Sometimes a smoothed momentum is used to reduce its volatility. For these purposes, moving averages are used.
The indicator in most cases is ahead of the main price movement. Before the top of the trend indicator turns around (prices in this case usually continue to grow) and begins to fall, only after that the trend usually turns down. Before the market’s low, the indicator slows down (prices usually continue to fall, but at a slower pace), unfolds and begins to grow, after which the trend turns up.
How to use Momentum Indicator?
- Oscillator technical analysis Momentum can be used as the oscillator (although such is not in the classic sense is not). A sell signal appears when Momentum or its moving average rises by a significant amount, unfolds and begins to fall. A buy signal appears when Momentum or its moving average falls by a significant amount, unfolds and starts to rise. This “significant amount” will differ on each currency pair in Forex and it should be tested separately.
- The indicator Momentum can be used in Forex as a trend indicator, in this case the crossing of its zero line is used as a signal. When the line crosses from the top to the bottom, a sell signal is given, when a buy signal is sent from the bottom to the top.
- The momentum indicator also uses divergence analysis.
- If prices make a new high on the chart that is higher than the previous one, and Momentum at this time makes a new high on its chart, but lower than the previous one, this means that the upward movement of the movement may begin to turn down soon.
- Conversely, if prices make a new low on the chart on the chart that is lower than the previous one, and Momentum at this time makes a new low on its chart, but higher than the previous one, this means that a downward trend may turn up soon.
Disadvantages of Momentum indicator
Disadvantages of the momentum indicator, the same as in many other indicators: it changes rapidly when entering the calculation of new prices very different from the main channel and when they exit from the calculation. This behavior gives greater instability of results.