Hang Seng Technical Chart | 10 Feb 2011
Hang Seng technical chart shows beginning of correction. This is the chart with Ichimoku indicator.
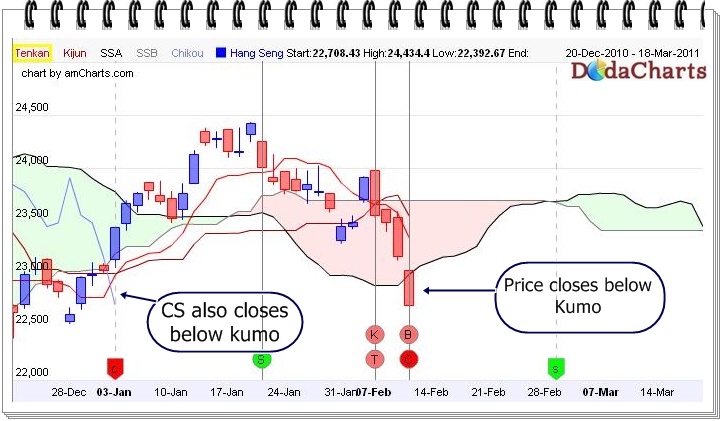
On 7th Feb 2011, the price closes below kijun sen line with cross of tenken sen and kijun sen. That was the first sign of weakness and opportunity to exit long position. It’s closing level was 23553 on that day.
After 3 trading sessions, on 10 Feb 2011, index closes below kumo and Chikou Span (CS) line also closes below kumo. That was the confirmation of beginning of downtrend. At the time of writing this article, Hang seng index last closing was 22708.
Seems, one can take short position now with a stop-loss of kumo.