HDFC Bank Ltd. Technical Chart | 14-Jan-2012
Below is the technical chart of HDFC Bank Ltd., listed on Indian stock exchange, using Ichimoku Kinko Hyo indicator.
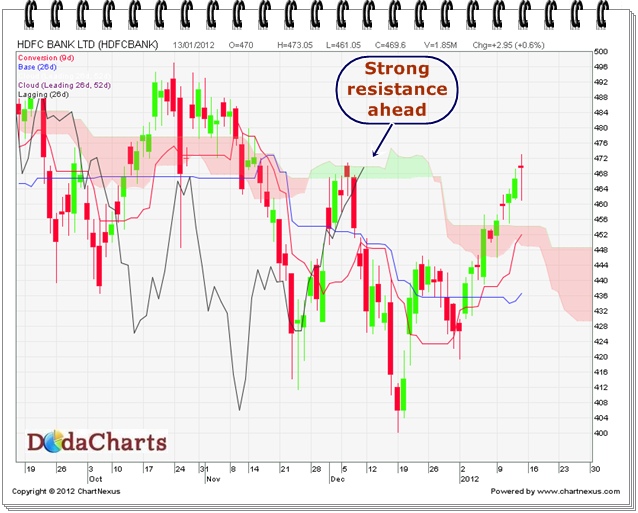
Although the price has crossed kumo @455.70 few trading sessions back, the Chikou-Span (CS) line is still below kumo. It’s just kissing kumo. It needs to cross and close above kumo. That will be the confirmation of kumo breakout in HDFC bank and then one can buy this stock for the target of 497 in short term. Make a stop-loss of 459.80.
Support level is at 448.