HDFC Ltd. Technical chart | 23-Dec-2011
Below is the technical chart of HDFC Ltd., listed on Indian stock exchange, using Ichimoku Kinko Hyo indicator.
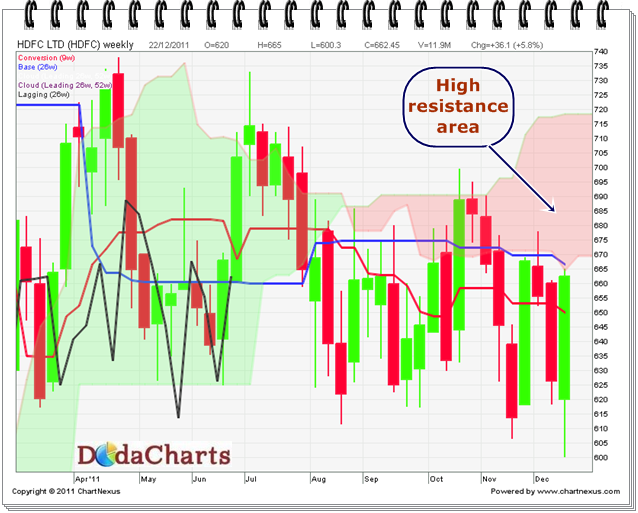
On a weekly chart, yesterday price touched kumo, which is the beginning of the high resistance area for this stock. Chikou-Span (CS) line is also inside kumo now. So, there is no hurry to buy this stock. Let the stock cross kumo and then that will be the right time to buy this stock, even for long term. But not before that. Infact, use this rally to exit from this stock and re-enter at the levels of 719.