Heikin Ashi Candlestcik - how to use effectively?
Heikin Ashi means the average sea bass in Japan. It was developed to filter out the market noise made by the Japanese candlestick.
The Heikin Ashi chart is much easier to analyze than the Japanese candlestick.
In this article, I will show you exactly how to read Heikin Chart.
What Are Heiken Ashi Candles?
Heiken Ashi Candles designed by Munehisa Homma in 1700 , shows you average price data to create a graphical Japanese Candlestick that filters out market noise.
This candlestick is really different from the standard candlestick chart.
In the standard candlestick chart, the candles are independent of the last one. However, in Heiken Ashi, each candle is dependent based on Heiken Ashi Formula.
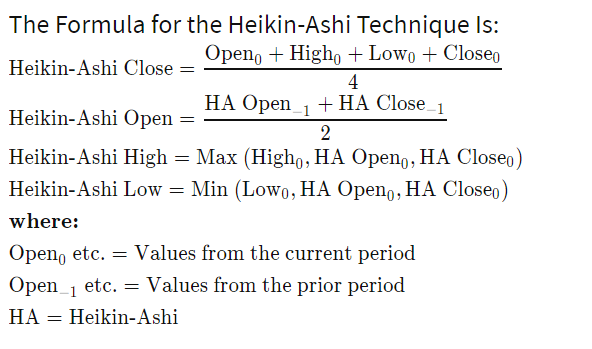
Heiken Ashi Candles Formula
The Heiken Ashi uses a modified formula based on two period averages. This helps the chart appear smoother and clearer, which helps traders easily identify the trend.
The Heiken Ashi formula is given below:
Heiken Ashi Intraday Strategy
From the point of view of graphical analysis, you can use and work out all the standard patterns: triangles , flags , "head and shoulders" and others. The working timeframe is recommended to be at least H1, but given the delay, you should not go lower than M30. Let us remind you once again that currency pairs should be with increased volatility, otherwise Heiken Ashi candles will smooth out not only the "noise", but also quite profitable sections of the trend.
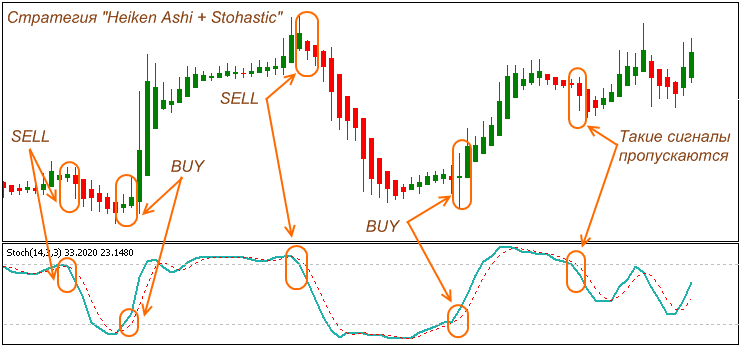
The first signal will be a change in the color of the Heiken Ashi candle and the simultaneous exit of Stohastic from the extreme zones: overbought for buying (BUY) and oversold for selling (SELL). Such a signal is considered reliable, and we enter the market on the next candle.
Stohastic allows you not to wait, as required by the classic description of the indicator, when three Heiken Ashi candles of the same color appear. At the same time, when it is late with the exit from the overbought / oversold area, as shown in the figure, it is better to wait for the next signal.
At the first signs of a Stochastic reversal, it is recommended to close the trade regardless of the current level of profit/loss.
The next oscillator showing good results in combination with Heiken Ashi will be the MACD indicator. The combination of two time delays gives good results on timeframes from H1 and higher.
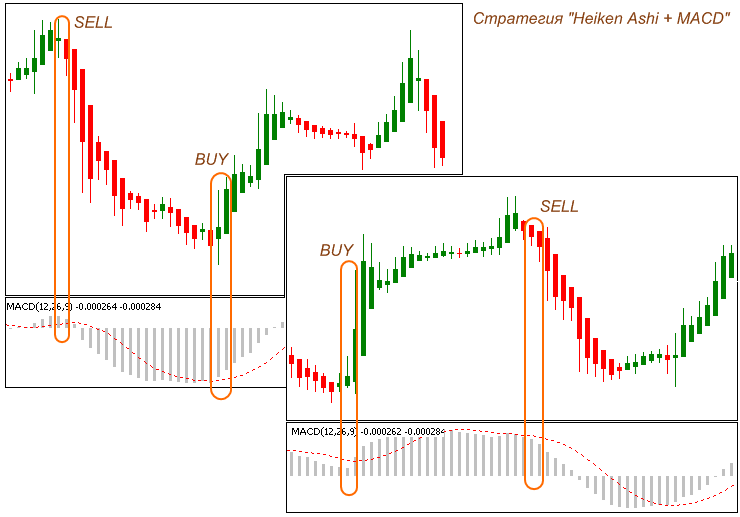
In addition to the classic confirmations of signals by crossing the zero level of the MACD, you can trade more complex situations when its histogram is completely above or below it. As soon as it starts to approach the central line of the oscillator, a leading signal appears for Heiken Ashi. We open a position only after the color change and the appearance of at least two candles!
Recommendations for use of Heiken Ashi Candles
- Heiken Ashi candles are not applicable for the scalping strategy and in general for small timeframes less than M30, but even on it we open only intraday trades lasting at least 3-4 hours. Given the delay, this is quite logical, but many beginners, seeing strong trends at first glance, try to apply them wherever possible and impossible.
- Despite the fact that you can use Heiken Ashi on any currency pairs, it is better to stay on the main ones (euro, dollar, yen) and not get too carried away with the exotic (Mexican peso, Indian rupee, and others). Although such currencies show a strong intraday movement, on which you can try to capitalize, you should not be deceived by a chart that has a lot of long candles. In fact, we have low liquidity and strong dependence on fundamental factors. In such conditions, all of the above strategies and signals practically do not work.
- Experienced traders on higher timeframes can enter trades using only Heiken Ashi to control the “momentum of the market”, but this approach is more suitable for the stock market, where the trends are more calm. However, in dynamic Forex, there is always a risk of a quick reversal of even a long-term trend, so take into account the data of other technical indicators.
- The development of chart patterns poses a dilemma for traders: open a deal as the description requires, for example, on the next bar after the breakdown of the “triangle” resistance line , or wait until three Heiken Ashi candles are of the same color.
- In this case, it is better to enter the market on the signal of the pattern. Still, graphical analysis sees the market situation more comprehensively and reacts more accurately to its changes. You can lose a significant portion of your profits by waiting for the candle to change color.
- Heiken Ashi candles show the end of a local correction or rollback well . The closer the resumption of the trend, the larger the shadow of the candles , even if the size of the body remains at the same level, it is recommended to fix the current profit / loss when the chart color changes to the opposite one.
- It is necessary to take into account not only the volatility of the trading instrument as a whole, but also its average values ??for Forex trading sessions . For example, pairs with the euro are the most dynamic, which means that the Heiken chart is the most informative in the European session . And, conversely, on the Asian volumes fall sharply, as well as the size of the candles. This is where many strategies fail.
Summing up, we can say that Heiken Ashi is one of the best trend indicators and lagging is not a significant drawback, unless of course M1-M15 timeframes are used. Opening late by 1-2 bars, on the contrary, will allow you to enter on a really strong signal and close exactly at the end of the trend.
Heiken Ashi candles do not react to random market fluctuations and perfectly show medium and long-term movements, but it is better to open positions only after additional confirmation in a complex trading strategy, and not during a flat period .
Generally:
If you are a trader who wants more profit and is fine with moderate risk, the 15 minute chart is best for you.
Advantages of using Heiken Ashi Candles
- Minimum risk
- good signals
- Idol of conservative traders
Disadvantages of using Heiken Ashi Candles
- low profit
- less trade
Overall: If you are a trader who does not like to take too much risk and is fine with low profit and fewer trades, the 30-minute and 1-hour chart is surely for you.