Hero MotoCorp Technical chart | 01-Nov-2011
Now, let’s analyze the technical chart of Hero MotoCorp with Ichimoku indicator.
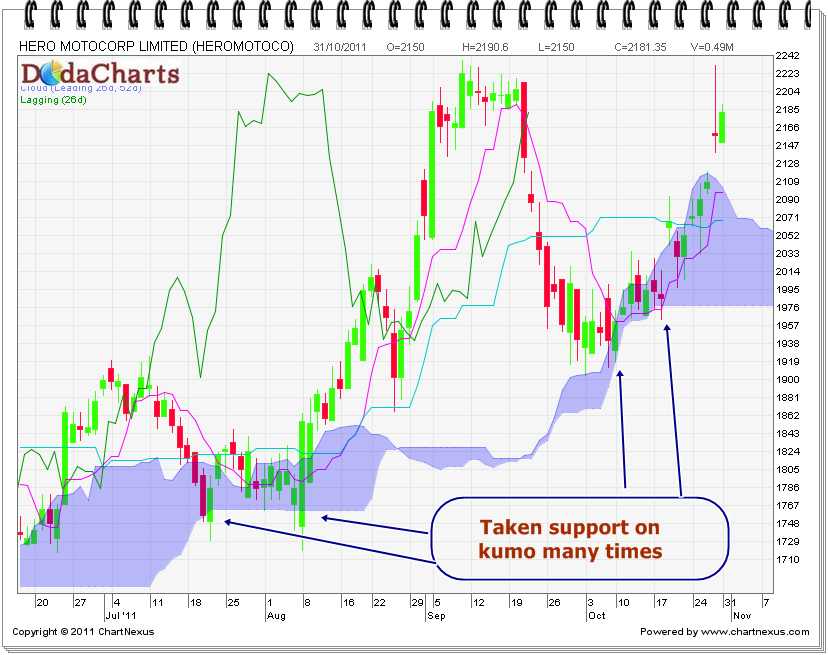
Kumo area of ichimoku – the blue region shown in the above chart, always acts as support levels if the price is trading ABOVE this level. So, if you see the chart carefully, you’ll observe that everytime when the price of Hero MotoCorp started to fall, it managed to take support on kumo level. The chart is in bullish mode.
The major support levels are : Rs.2068, Rs.1978 and major resistance levels are: Rs.2224 and Rs.2235