Hero Motocorp Technical chart | 14-Dec-2011
![]() Below is the technical chart of Hero Motocorp Ltd., listed on Indian stock exchange, with ichimoku Kinko Hyo indicator.
Below is the technical chart of Hero Motocorp Ltd., listed on Indian stock exchange, with ichimoku Kinko Hyo indicator.
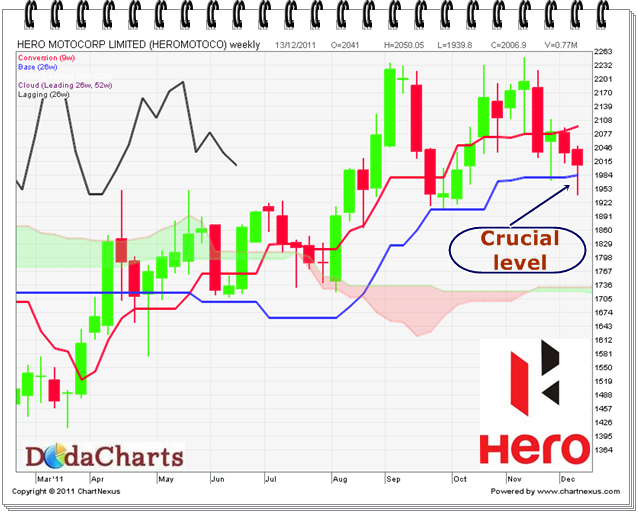
The chart is still intact and in bullish mode. The whole market is in downtrend but this chart managed itself to hold the bullish mode. But at this stage, the price is trading near very crucial level viz. at 1980.60. If it breaks this level, it can go down to the level of 1730. So, make your stop-loss accordingly.