Hewlett Packard Co. (HPQ) Technical Chart | NYSE | 06-Dec-2011
Below is the technical chart of Hewlett Packard Co., listed on NYSE, with ichimoku kinko hyo indicator. I’ve used Weekly time frame for below mentioned reasons.
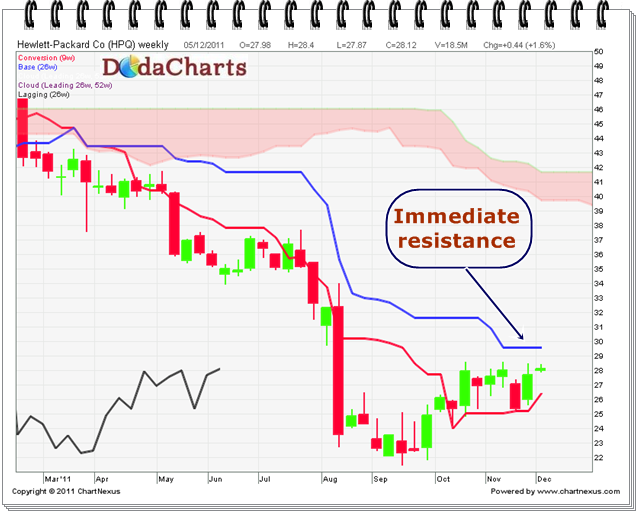
The stock gave bearish breakout on 25-Feb-2011 @42.68 as the stock closed below kumo on weekly chart. That was a very negative sign.
Whenever the stock closes below kumo on weekly chart along with Chikou Span (CS) line, that means the medium term outlook for the stock has become negative.
Now, after touching the lows of 21.5 on 23-Sep-2011, it started to bounce back. But looking at the chart, it will face tough resistance at 29.61, which is the level of kijun-sen line. Once it CLOSES above this level, it will start its bull run as by this level, price and chikou-span (CS) line will CLSOE above kumo on daily chart. The next resistance will be at 39.39 to 41.67.