Hindalco Industries Technical Chart | 05-Dec-2011
Let’s discuss the technical chart of Hindalco Industries, listed on Indian stock exchange, using ichimoku Kinko Hyo indicator.
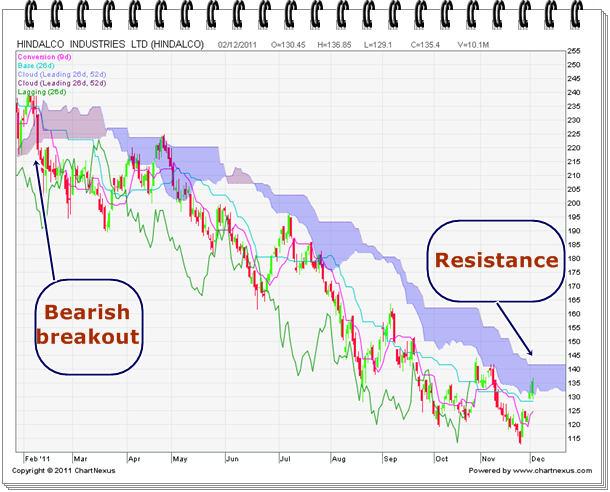
On 12-May-2011, Hindalco closed below kumo @195.15, thus giving bearish breakout. It started its downward journey from there.
It started to bounce back from last few trading sessions. But still, it is not the right time to buy it.
Hindalco will face touch resistance at 141.40-152. The reason is clearly visible from the chart. It will face kumo now. Buy it ONLY when it CLOSES above these levels.