Hindustan Copper Ltd. Technical chart | 05-Jan-2012
Below is the technical chart of Hindustan Copper Ltd. (HINDCOPPER), listed on Indian stock exchange, using Ichimoku Kinko Hyo indicator.
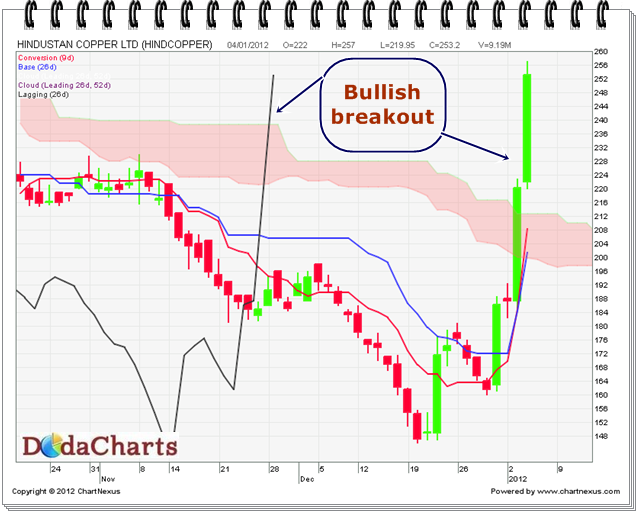
Yesterday, the share of Hindustan Copper Ltd., closed above kumo; so is the chikou span (CS) line. So, the chart shows bullish breakout. One can buy this stock with a stop loss of 210 for a target of 279. It’s resistance area is from 279-360. So, if the stock coming down from these levels, just book your profits and sit on cash.