How to Use ADX (Average Directional Index) in Forex
The indicator ADX (Average Directional Index) is a unique indicator capable of working ahead and showing the strength of the trend (whether it will continue or will gradually decline), before the price moves.
Introduction to ADX Indicator
Indicator ADX (Average Directional Movement Index) – a popular indicator, through which determine the strength and prospects of the current market trend. The tool was developed by the famous trader Wells Wilder on the basis of his other two programs – Positive Directional (+ DI) and Negative Directional Indicator (-DI). With the author’s interpretation of this indicator can be found by reading the book “New concepts of technical trading systems.”
Benefits of ADX Indicator
Using the ADX indicator, you can determine:
- the presence of a price trend (trend)
- the best time to open a buy order
- the best time to open a sell order
- the moment when you need to fix the profit
Calculation of ADX
The ADX index works on a combination of two other indicators developed by the same Wilder to determine the trend direction:
- + DMI (or simply DI) or positive directional movement indicator – indicator of positive directional movement;
- -DMI negative directional movement indicator-Indicator of negative directional movement.
Often in exchange terminals ADX, + DI and -DI are displayed in one window under the graph in the form of 3 lines.
To calculate + DI and -DI, you need data on the closing prices, as well as the highs and lows of each bar on the chart for the specified period (usually day bars). First, the direction of travel (+ DM and -DM) is calculated:
- Up = Today High Bar – Yesterday High
- Down = Yesterday Low – Today Low
- If the value Up> Down and> 0, then + DM = the value Up. Otherwise + DM = 0
- If the value is Down> Up and> 0, then -DM = Down. Otherwise, -DM = 0
After selecting in the period settings (the default value is 14), there is a calculation of + DI and -DI:
- + DI = 100 * smoothed ma + DM / ATR
- -DI = 100 * smoothed ma -DM / ATR,
- where smoothed ma is the smoothed moving average, which is calculated for the selected period, and ATR is the smoothed average of the true range.
The ADX formula is as follows:

Determining the strength of the trend with ADX
ADX is initially a momentum indicator that determines the strength of the trend pulse, regardless of the direction in which this trend is moving.
Its line fluctuates on a scale in the range from 0 to 100. Many traders believe that the value of 25 and above indicates a fairly strong trend, suitable for trend trading strategies.
Now consider the ranges of the values of the ADX line, how to work with them, and what market conditions they correspond to:
- 0-25: corresponds to the period of accumulation and distribution of money in paper. The price is consolidated between the support and resistance level. The trader is watching.
- 25-30: the beginning of the movement is the moment when the price breaks through the resistance level. Golden time to open a position.
- 30-50: a strong trend, gaining momentum. It is worth using it to add to the position.
- 50-100: peak area where the impulse decays. This does not mean that the trend is over – the price can simply be consolidated or rolled back. But how long can this period last? Again waiting.
Despite the fact that the ADX indicator is in the range from 0 to 100, they are extremely rarely taken above the 60 mark. The ADX reading below 20 indicates a weak trend, and above 40 – it indicates a strong trend. The readings above the 40 mark indicate the presence of a strong trend (both downward and upward). When the indicator is below 20, this indicates that there is no pronounced trend, i.e. consolidation, which should be avoided.
This indicator can also be used to identify potential changes in the market. When the indicator readings cross the border 20 from the bottom upwards – this may indicate a change in the trend and its further development. When the value of the indicator, which is above the 40 mark, drops below this level, then the current trend, most likely, loses its force.
If there is any trend in the market – bullish or bearish – the distance between the DI signal lines starts to increase and ADX starts to grow and, conversely, when the activity on the market decreases – the distance between the DI signal lines starts to decline and the ADX drops.
How to use ADX with +DI and -DI
The directional movement system was proposed and used by Wilder itself and is based on the intersection of the + DI and -DI lines with each other when the ADX is above 25.
If the ADX indicator is growing, this indicates that there is a trend in the market.
Setting for opening and maintaining a long position:
A buy signal is generated when + DI rises higher – DI and ADX itself grows.
At the moment when + DI is higher – DI, but ADX itself starts to decline, the indicator signals that the market is “overheated” and it’s time to fix the profit.
Setting for short positions:
A sell signal is generated when + DI is lowered below – DI and ADX is growing.
At the moment when + DI is located below – DI, but ADX itself starts to decline, the indicator signals that the market is “overheated” and it’s time to fix the profit.
It is believed that the trend is coming to an end when the Average Directional Movement Index is above other lines and continues to grow. In such cases, it is not recommended to open, in addition, it is worth thinking about closing old positions. If the curve decreases in the same position, you should also exit the transactions as quickly as possible. If the ADX indicator is at the bottom of the rest, then the longer it stays there, the more powerful will be the next trend.
ADX Example
Below is the technical chart of EURNZD currency pair on H4 time frame. I’ve plotted 3 variants of this indicator.
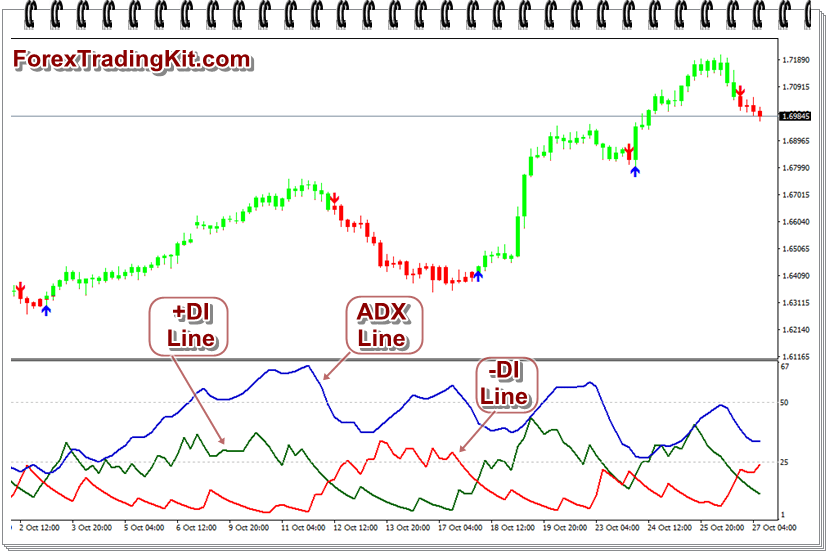
First one changes the colours of candles in the chart with either Red or Green as per the signal of ADX.
The second one plots Blue arrow as Buy signal and Red arrow as Sell signal on chart screen.
and the third one is the default indicator, which comes with MetaTrader 4. I’ve just changed colors and width of the line to get better screen view.
Now, note the intersection of +DI and -DI lines and see the price movement of the currency pair.
As it is clear from the chart itself, how easy is to use this indication.
Download ADX indicator for MetaTrader 4
You may download the above-mentioned variants of ADX technical indicator from here .
Disadvantages of ADX indicator
- Trend indicator – by definition in technical analysis is lagging behind. Do not expect that at the level of 25-30 there must necessarily be a breakdown of consolidation or similar things. First, the price will perform the action, and then they will be displayed by ADX – it will not work without delay.
- A lot of noise – different parameters, additional lines, modifications, and analogue – all this only distracts the trader from the main – graphics and price dynamics.
Summary
ADX with +DI and -DI is one of the best and easy to use technical indicator. But one should not just rely on one single indicator. You can consider using other technical indicators to use along with ADX like MACD , Stochastic , RSI , Doda Donchian , Ichimoku etc. Almost all forex trading software like MetaTrader provides these indicators.