Huntington Ingalls Technical chart | NYSE | 02-Dec-2011
 Below is the technical chart of Huntington Ingals, using ichimoku Kinko Hyo indicator.
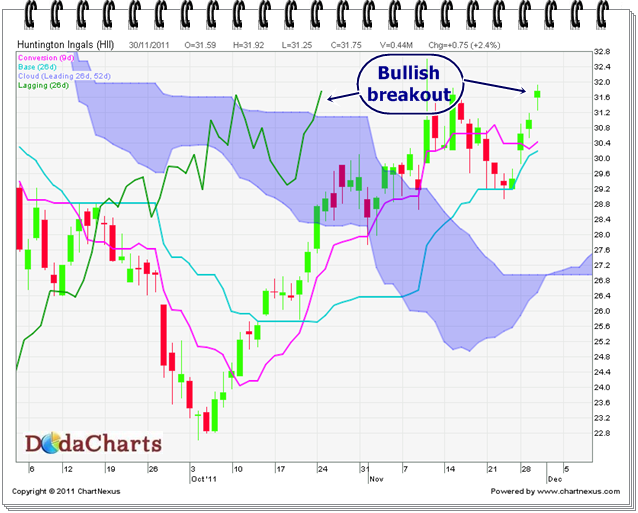
The chart has given bullish breakout couple of trading sessions back as Chikou-Span (CS) line and price closes above kumo. One can still buy this stock with a stop loss of 30.18 for a target of 33.99