Ichimoku Technical Indicator
The Ichimoku indicator is a comprehensive technical analysis tool introduced in 1968 by the Tokyo columnist Goichi Hosoda. The idea of ??the system was to be able to get a quick understanding of the mood of the trend, its dynamics and strength, interpreting all five components of the system in combination with price dynamics from the point of view of the cyclical nature of their interaction, due to the group dynamics of human behavior.
Using the Ichimoku indicator
The Ichimoku indicator consists of five lines that can serve as support and resistance lines, and their intersection can be regarded as additional signals:
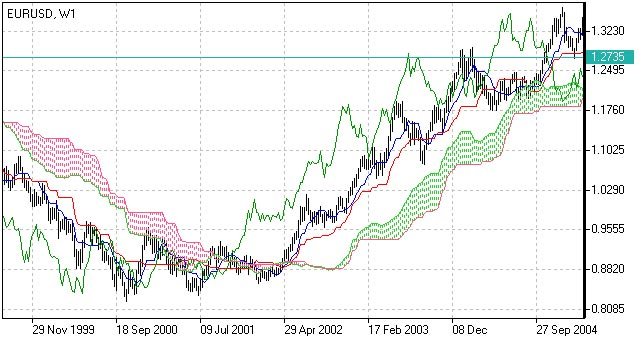
- Tenkan-Sen (Conversion line, blue )
- Kijun-Sen (Baseline, red )
- Senkou Span A (Leading line A, green cloud border)
- Senkou Span B (Leading line B, red cloud border)
- Chikou Span (Lagging Line, Green )
Kumo (Cloud) is the central element of the Ichimoku system, representing the support and resistance zones. Formed by Leading lines A and B.
Determining the presence of a trend and correction:
- The price moves above the cloud, indicating an uptrend
- The price moves under the cloud, indicating a downtrend
- The price moves in the cloud, indicating a sideways trend.
- The color of the cloud changes from green to red, indicating a correction within an uptrend.
- The color of the cloud changes from red to green, indicating a correction within a downtrend.
Determination of support and resistance levels:
- Leading line A serves as the first uptrend support line
- The leading line B serves as the second uptrend support line
- Leading line A serves as the first resistance line of a downtrend
- Leading line B serves as the second resistance line of a downtrend
Strong buy/sell signals appearing above the Ichimoku cloud:
- The conversion line crosses the Baseline from the bottom up, this is a buy signal.
- The conversion line crosses the Base line from top to bottom, this is a sell signal.
Weak buy/sell signals appearing inside the Ichimoku cloud:
- The conversion line crosses the Baseline from the bottom up, this is a buy signal.
- The conversion line crosses the Base line from top to bottom, this is a sell signal.
Ichimoku Strategy Indicator
Traders use this strategy to identify a trend. Buy signals are generated based on three criteria:
- The price rises above the lower line of the cloud.
- The price rises above the Tenkan-sen line (Conversion line).
- The price falls below the Kijun-sen line (Base line).
Calculation of Ichimoku Technical Indicator
- Tenkan-Sen (Conversion line, blue ) is (9-period high + 9-period low)/2
- Kijun-Sen (Baseline, red ) is (26-period high + 26-period low)/2
- Senkou Span A (Leading line A, green cloud border) is (Conversion line + Baseline)/2
- Senkou Span B (Leading line B, red cloud border) is (52-period high + 52-period low)/2
- Chikou Span (Lagging line, green ) is the closing price moved back 26 periods