Idea Cellular Ltd. Technical Chart | 02-Dec-2011
 Here is a technical chart of Idea Cellular Ltd., listed on Indian stock exchange, with
ichimoku
kinko
hyo indicator.
Here is a technical chart of Idea Cellular Ltd., listed on Indian stock exchange, with
ichimoku
kinko
hyo indicator.
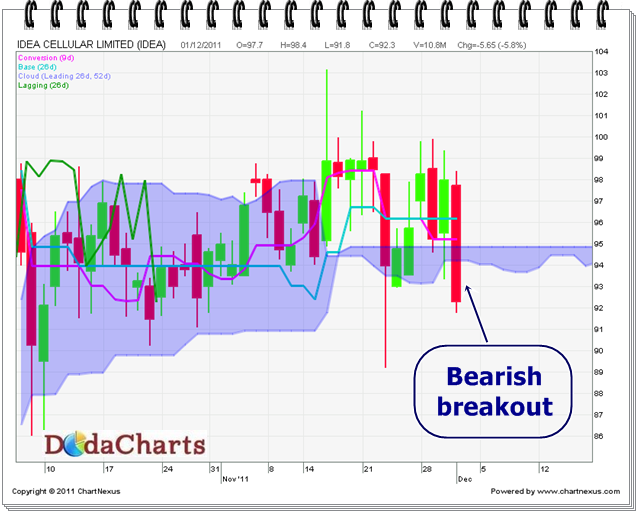
The story of Idea cellular Ltd. is somewhat similar to Bharti Airtel Ltd. Chart. From the last many trading sessions, the stock could not give any clear breakout – moving in the range bound near kumo levels.
In the last trading session, it gave bearish breakout @92.30 . Major support level is at 85.30, which is its weekly support level.
I would not suggest to take short selling call here, inspite of bearish breakout on daily chart, as on weekly chart, the price is still very well above kumo and kijun sen level. The price may come down little bit, but taking short call on these levels are very risky. It can rebound very speedly .
If it closes above above 94.86, take buy call.