IFCI Technical chart | 23-Nov-2011
Below is the technical chart of IFCI , listed on Indian stock exchange, with ichimoku indicator.
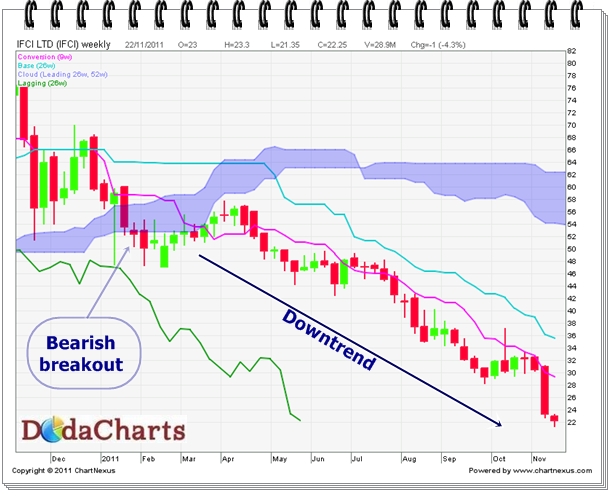 IFCI closed at 52.30 on week ending at 4-Feb-2011. That was first signal of its weakness and STRONG bearish breakout. It tried to move
kumo by moving sideways, but it failed. Then, it started its downward journey and yesterday, it closed at 22.25.
IFCI closed at 52.30 on week ending at 4-Feb-2011. That was first signal of its weakness and STRONG bearish breakout. It tried to move
kumo by moving sideways, but it failed. Then, it started its downward journey and yesterday, it closed at 22.25.
Even now, it’s a weak chart and one can expect a BIG fall from these levels. So, don’t be in hurry to buy this stock. Strong resistance is at 35.53 and strong support is at 15.60.