Infosys Ltd. Technical Chart | 02-Dec-2011
![]() Let’s discuss the technical chart of
Infosys Ltd., listed on Indian stock exchange. I’ve used the same
Ichimoku
Kinko
Hyo indicator.
Let’s discuss the technical chart of
Infosys Ltd., listed on Indian stock exchange. I’ve used the same
Ichimoku
Kinko
Hyo indicator.
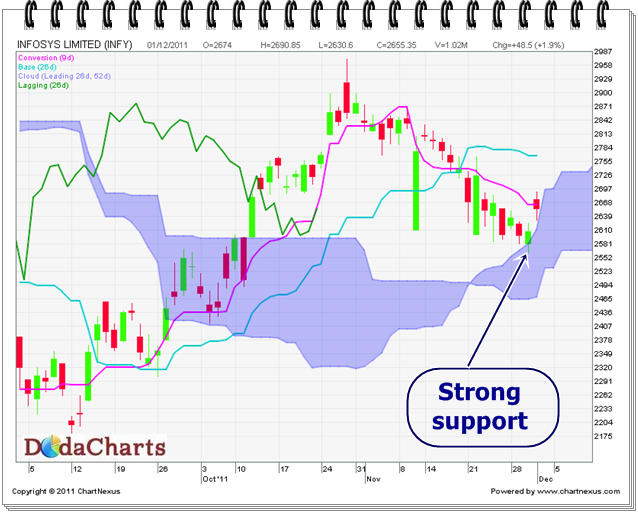
It’s very much clear from the chart, that Infosys is trading very major support level – kumo . And that’s a very positive sign for it.
On the upside, it will face resistance at 2766.30. Closing above this level will re-start its upward journey.
On the downside, 2593 is a very important level to watch. If it closes below this level on weekly time frame, exit from it.