Infosys Technical Chart | 07-Dec-2011
Let us discuss the technical chart of Infosys Ltd., listed on Indian stock exchange, with Ichimoku Kinko Hyo indicator.
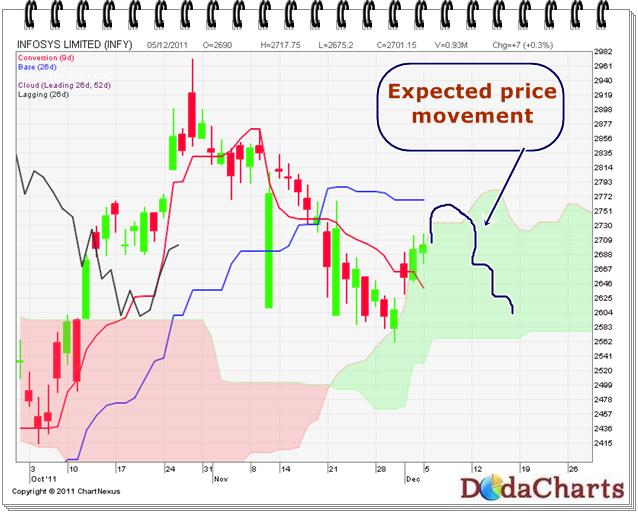
Infosys price is taking support near kumo levels. But in the short term, it can break its support and can kiss the levels of 2592 after touching the high of 2765.
I’ve marked the expected price movement of this stock with blue line in the chart.
Take your positions accordingly.