Infosys Technical Chart | 17-Jan-2012
![]() Below is the technical chart of Infosys, listed on Indian stock exchange, using Ichimoku Kinko Hyo indicator.
Below is the technical chart of Infosys, listed on Indian stock exchange, using Ichimoku Kinko Hyo indicator.
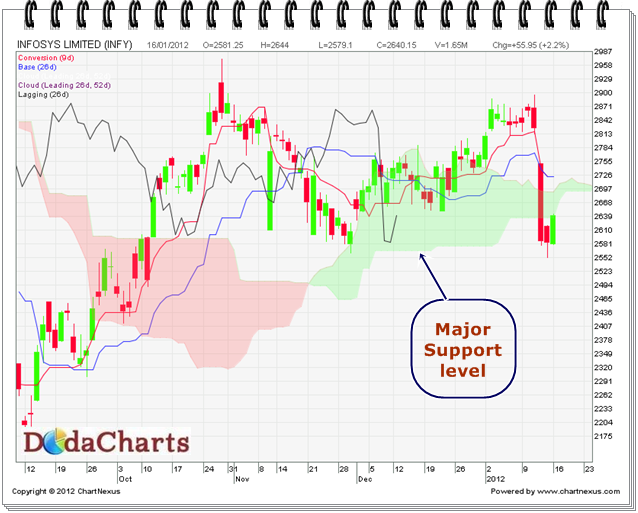
Infosys stock price is trading below kumo. So, there is no point in purchasing this stock at this level. Chikou-Span (CS) line is trading inside kumo. Once is starts trading below kumo, i.e. below 2564, one can take short positions in this stock.
Long position is suggested only above 2760 and not before that.