Inside USDJPY currency pair Chart | 29-June-2011
 In the last topic, I’ve discussed one of the important rule of forex trading using GBPCHF technical charts.
Today, I’m analyzing USDJPY currency pair chart on weekly and monthly time frame. We’ll conclude some important trading rule again.
Here is a USDJPY weekly chart using my favorite indicator Doda-Donchian.
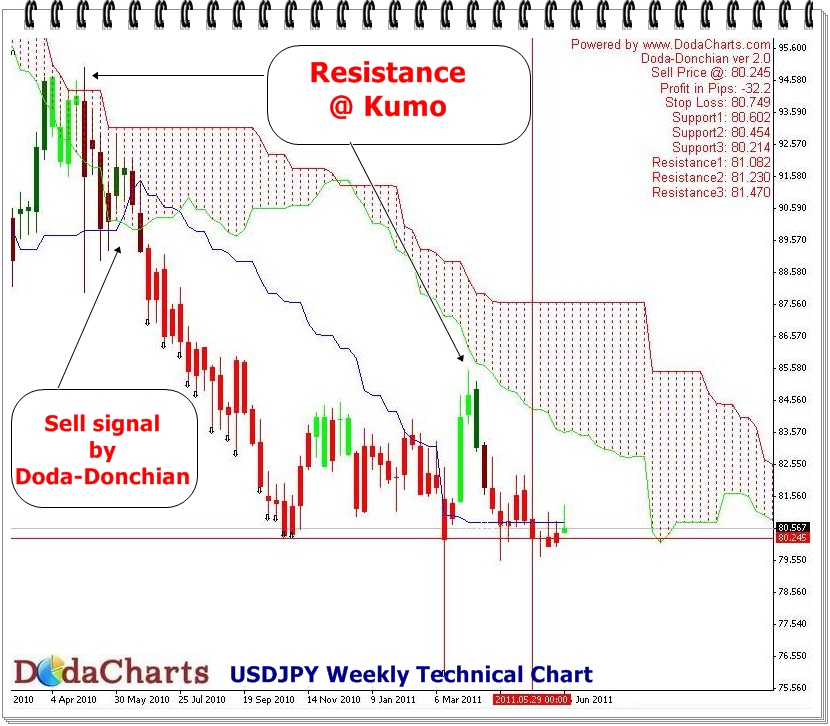
The chart says too much of things. Let’s take one by one. This currency pair, on its weekly chart, is trading below kumo, indicates inherent weakness of the chart. So, it’s suggested NOT to take any "Buy" call and NOT to miss any "Short call".
In around 2 instances, it tried to cross kumo but faced strong resistance there and failed (see the above chart).
Now, let’s see the technical chart of USDJPY on monthly time frame.
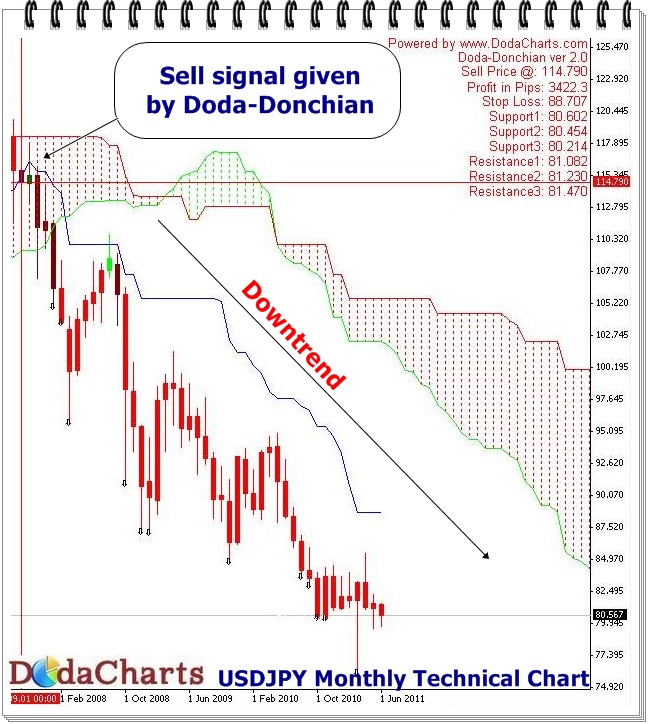
The story confirmed by this chart. Doda-Donchian gave sell signal on around Aug 2007, when it was trading around 114.79. It well traded below kumo and Doda-Donchian line. The downtrend still continued and at the time of writing this post, it gave a profit of about 3422 pips.
I understand that an individual takes call on shorter time frames like M30, H1 or H4. But BIG traders like Banks, companies etc. takes calls on bigger time frame like weekly or monthly time frame. Such signals should not be missed by them.
So, what’s the conclusion?
Before taking any call on shorter time frame like H4, see the chart on bigger time frame. That will give you idea, which call you should take to make big profit. E.g., as discussed above, on USDJPY chart, one should take only "Sell" calls on H4 time frame and ignore any "Buy" call as on weekly and monthly time frame, this currency pair is in downtrend.
The situation will be reversed ONLY when it starts trading above Kumo and Doda-Donchian line.