Introduction to Aroon indicator
The Aroon indicator developed by Tushar Chande, indicates if a price is trending or in range trading. It can also reveal the beginning of a new trend, its strength and also allows you to anticipate changes from trading ranges to trends. AroonDown and the AroonUp indicators are used together and combined are called the Aroon indicator. The Aroon indicator is often used to determine whether a stock is trending or not and how stable the trend is.
AroonUp measures how long it has been since prices have recorded a new high within the specified period. If the current price is higher then the user defined number of periods before it, then the AroonUp value is %100. In other words, it’s a new high for that period. If a new low occurred during the period then AroonDown will be zero. Otherwise it returns a percent valve indicating the time since the new high occurred.
AroonDown measures how long it has been since prices have recorded a new low within the specified period. If the current price is lower then the user defined number of periods before it, then the AroonDown value is %100. In other words, it’s a new low for that period. If a new high occurred during the period then AroonDown will be zero. Otherwise it returns a percent valve indicating the time since the new low occurred.
Another indicator, the Aroon Oscillator, can be constructed by subtracting AroonDown from AroonUp.
Why to use Aroon indicator?
The best thing about this indicator is that it identifies the trend for you first and foremost. You don’t have to make an effort to assess what the current market trend is as the indicator will do it for you. The trend will be found out keeping in mind the currency pair you are trading. Once the trend has been established, the indicator will then work out whether there is any probability of the trend reversing or altering its course all of a sudden. A line chart is use to present this indicator visually. This is the best way of explaining this to the newbie traders who are not experienced enough to be able to assess it based on their knowledge.
As you can see from the name – Aroon helps to predict important changes in the market. Namely, the transition from flat to trend and vice versa. From Sanskrit, the word Aroon translates as “Light of the Dawn”, which is symbolic, since the indicator, in a calm market, really gives its signals in advance.
Arun, the trend indicator (Aroon) consists of two lines: Aroon up (green line) and Aroon down (red line).
The main advantage of the indicator is that it is visually intuitive and simple. A minus is a slight delay in the signals with high volatility. But, for the sake of justice, it is worth saying – this is a minus of almost all technical indicators.
The Aroon indicator is a conceptually simple technical indicator. Developed in 1995, it is newer than many of the more popular technical indicators. But for some reason, not all charting web sites offer the Aroon indicator. Yahoo! Finance doesn’t offer it. Neither does CME Group. Two charting web sites that do are Stockcharts and Barchart.
Calculation
Calculation of the two outputs of the Aroon indicator Aroon High and Aroon Low, involves only a single parameter, a span parameter specifying the number of bars over which to calculate the indicator. The most common setting is 25 days. The formulas are:

Interpretation
Tushar describes the following trading signals :
1. If Aroon down under 50, signals that the bearish trend is weakening
2. If Aroon up under 50, indicates that the bullish trend is weakening
3. If Aroon down above 70, signals a strong bearish trend
4. If Aroon up above 70, signals a strong bullish trend
- The green line in the 70-100 zone is a strong growing trend;
- The green line in the 50-70 zone is a high probability for an increasing trend;
- The green line in zone 50-30 is a fading growing trend;
- The green line in zone 30-0 is the absence of a growing trend;
- The red line in the 70-100 zone is a strong falling trend;
- The red line in the 50-70 zone is a high probability for a falling trend;
- The red line in zone 50-30 is a fading down trend;
- The red line in zone 30-0 is the absence of a falling trend;
- Parallel movement of lines – consolidation of the market;
- Crossing lines – changing the trend.
Deal for Sale
- The lines intersected. Red from above and is in the zone above 70. Green from below and is in the area below 30. Sell.
- Stop Loss put on 3-5 points above the previous local extremum.
- Take Profit set at a distance of two and a half times longer than Stop Loss. That is, if the SL stands at minus 20 points, then TP is set at plus 50 points from the current price.
- When crossing the Aroon lines, we close the deal, without waiting for the triggering of the SL or TP orders.
For a transaction to buy the reverse terms.
How to read Aroon Indicator
1. Below zero signals a bearish trend
2. Above zero indicates a bullish trend
3. The farther Aroon indicator from the zero line , the stronger the trend
Weakness in the market is indicated when AroonDown remains between 0 and 30 for an extended period of time. If AroonDown and AroonUp follow similar movement patterns, this is a sign of consolidation. Finally, AroonDown crossing below AroonUp is considered a bearish sign.
When AroonUp is at 100, a new uptrend may have begun. If it remains persistently between 70 and 100, and the AroonDown remain between 0 and 30, then a new uptrend is underway. If AroonUp dips below 50 then the trend has lost momentum.
When AroonDown is at 100, a new downtrend may have begun. If it remains persistently between 70 and 100, and the AroonUp remain between 0 and 30, then a new downtrend is underway. If AroonDown dips below 50 then the trend has lost momentum.
Trading ranges and consolidation: When AroonUp and AroonDown move in parallel (horizontal, sloping up or down) with each other at roughly the same level, then price is range trading or consolidating.
New Trend, if the AroonUp crosses above the AroonDown, then a new uptrend may soon start. Conversely, if AroonDown crosses above the AroonUp, then a new downtrend may soon start.
Examples
Below is the technical chart of Gold on H4 timeframe using Aroon indicator.
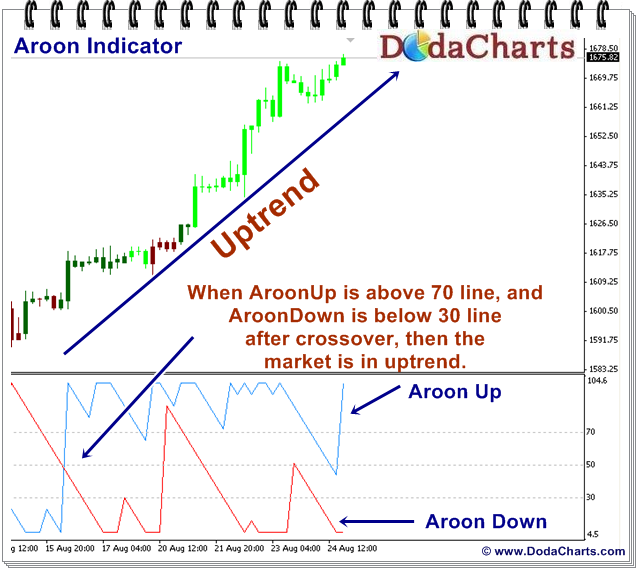
As you can see in the above chart, Gold price started its uptrend journey as soon as there is a crossover between AroonUp and AroonDown line. AroonUp line above 70 and AroonDown line down below 30 was the final signal to buy.
2. Below is the technical chart of Crude using Aroon indicator.
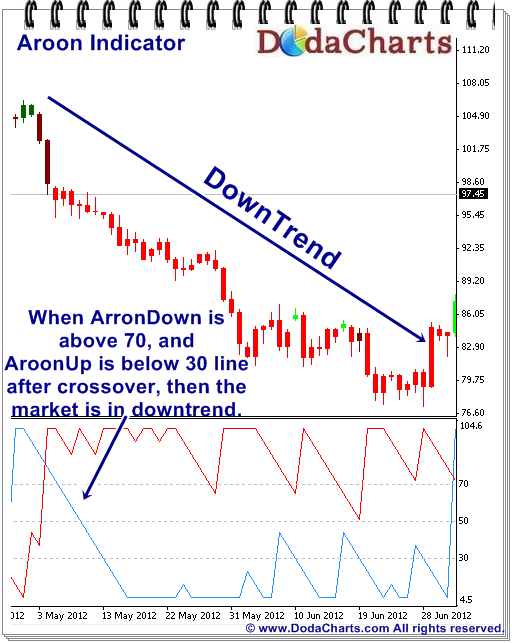
As you can see in the above chart, the downtrend in Crude started when AroonUp and AroonDown crossover happens and are below 30 and above 70 respect.
How to filter false signals from Aroon indicator?
Like others, Aroon indicator also gives false signals sometimes. You must learn that no indicator is perfect and you need to filter out false signals from that indicator.
Remember, there are no indicators on Forex that are not mistaken. Aroon (Arun, trend indicator), like any other, requires confirmation of its signals. When building your own trading system, use several indicators.
The best way to filter out false signals from Aroon indicator is to use 63-days Exponential Moving Average (EMA) indicator.
Now, if the price is trading above 63-days EMA AND there is a buy signal from Aroon indicator – take long position and vice-versa.
On the other hand, if you get buy signal from Aroon indicator but the price is trading below 63-days EMA, do not take that call. It’s a false signal.
Download
Download Aroon indicator for MetaTrader4
Download Aroon indicator for MetaTrader5