Introduction to Renko Charts
Renko Charts are one of the types of graphs created by Japanese traders. One of the main differences between the graphs Renko from charts bars, lines, or Japanese candlesticks is that Renko does not include any time or volume of trading. It is believed that the name of the graph comes from the Japanese word brick “renga”.
In Europe and the US, Renko’s graphics became popular after the publication of the book “Beyond the Candlelight” (Beyond Candlesticks).
Building Renko Charts
The Renko charts are constructed as follows: the closing price of the current period is compared with the levels of the minimum and maximum of the previous “brick” (white or black). If the closing price of the current period rises above the maximum of the previous “brick” at least by the size of the “brick”, then on the graph in the new columns one or more white “brick” is drawn.
If the closing price of the current one falls below the minimum of the previous “brick”, not less than the size of the “brick”, one or more black “brick” is drawn on the chart.
If the closing price moves below the minimum or maximum of the previous “brick” to more than one “brick”, but it is not enough to form two “bricks”, only one “brick” is drawn.
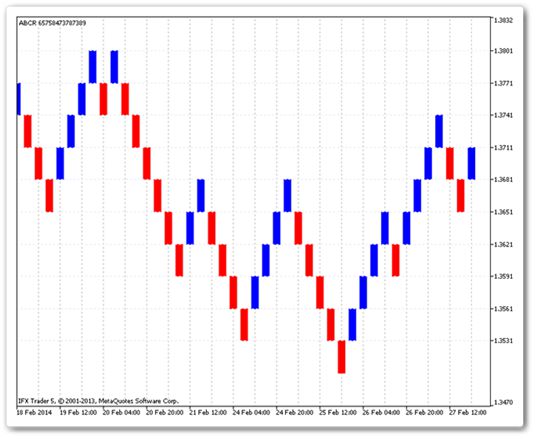
Thus, a new “brick” appears on the chart , if the price passes the maximum or minimum of the previous “brick” by a certain amount (the size of the “brick”). Accordingly, the frequency of appearance of new bricks depends only on the movement of the price of the asset and does not depend on time. All the bricks on the chart are the same in size, which is determined by the trader in their own technical analysis program and should be more or equal to the minimum price change of the asset. For example, if you are building a Renko chart with a brick of 20 points, an upward movement of 100 points will look like 5 white bricks.
Usually, for a trend upwards, white bricks are used, and for a trend downward painted bricks, but in each program of technical analysis, their colors can be used.
Many trading software like MetaTrader allows you to draw Renko charts, using custom indicator.
Advantages of Renko Charts
Using graphs Renko (Renko the Charts) believed that the graph Renko is a very effective tool to identify key levels of support and resistance, since the filter main trend of the asset, not considering minor fluctuations in prices. The main signals to the entrance to the market appear when the direction of the trend changes and accordingly the color of the “brick” becomes different.
For example, an order to sell comes when a series of white ends, and the first black brick appears. An order to buy occurs when a series of black bricks ends, and a white brick appears.
Notes:
Because Renko Charts was created to determine the main trend of the asset, the chart itself gives a lot of false signals , especially on lateral movements and short trends, but it almost always allows you to catch the main part of the big trend.
Renko charts are always built based on the closing prices of the period they are considered, so when they are created from charts of another kind with different periods, the result may be different. The larger the scale on which the Renko chart is based, the greater the likelihood that its main flaw will be manifested – changing its readings in real time, so it’s best to build Renko’s graphs based on tick or minute data.
Limitation of Renko Chart
On the Renko chart, you can use the same types of graphical and indicator analysis that charts of bars and Japanese candles predict; however, one should take into account a number of points:
- on the Renko chart, the minimum and maximum of the white “brick” always coincide with the opening and closing prices, respectively, and the minimum and maximum black brick, on the contrary, with the closing and opening prices of this “brick”, so the indicators using the calculation of the prices of opening, closing, minima, and maxima within one “brick” may not work correctly.
- since there is no volume in the Renko chart, the indicators taking into account the volume will not work at all.