ITC Technical chart | 10-Dec-2011
Below is the technical chart of ITC Ltd., listed on Indian stock exchnage, with ichimoku Kinko Hyo indicator.
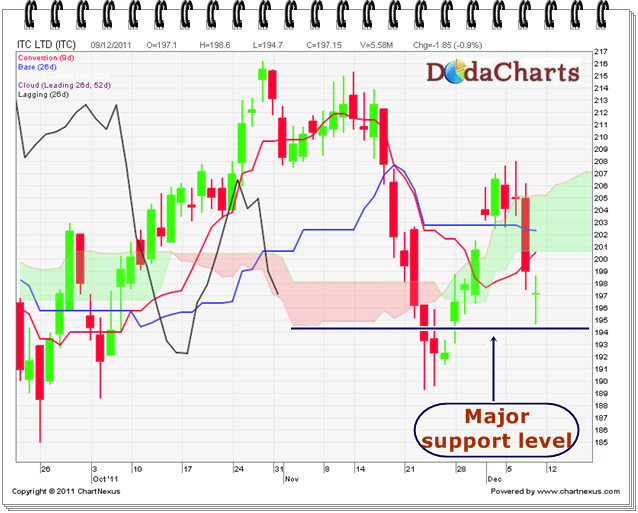
ITC is trading below kumo, so the chart itself is weak. The only positive point here is that Chikou-Span (CS) line is still inside kumo. So, the major support level comes out to be at 1974.30. If ITC breaks this level on closing basis, it will move further down to the next support level of 189.30.