Japanese Candlestick Hammer Pattern
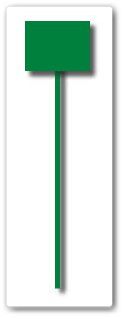
The hammer is a formation in the so-called “candlestick chart technique”. The hammer predicts a turnaround after a falling price. The formation consists of a single candle, which has a long lower shadow, a small candle body and a very small, ideally no upper shadow.
Japanese Candlestick Hammer Pattern
The characteristic features of the Hammer are that this candle has a long lower shadow and a short body, i.e. graphically resembles a hammer, so it’s very easy to see on the chart.
The hammer is formed on the descending trend (otherwise, the candle with the same characteristics will have the name Hanged ). The hammer marks local minima and heralds further growth. Therefore, the Hammer is a bullish figure.
Japanese Candlestick Hammer Pattern Characteristics
The color of the Hammer does not matter. What matters most is the length of the shadows and the body. In order for the Japanese candle to meet the criteria to be called the Hammer, it must have the following simple features:
- small body (approximate in shape to square)
- long lower shadow (minimum 2 times longer than the body)
- there is no upper shadow (or very small)
- a large daily spread of prices (ie minus a maximum)
- is formed on a downtrend (otherwise, has a different name)
How to identify Japanese Candlestick Hammer Pattern
The opening price is very low, usually below the closing price of the previous trading period. Over the course of the market, prices continue to fall sharply, setting a new low, causing the bottom shadows. In order to form a hammer, the prices must then record a constant plus; Ideally, prices will rise until the end of the market period, then it is likely that they will continue to rise. In this case, the candle has no wick. If she has a small wick, this means that prices have fallen again at the end of the market period, which in turn reduces the significance of the hammer as a buy signal. In principle, it is only possible to speak of a hammer when the lower shadow is more than twice the size of the candle body. Only then can a change in trend be expected with sufficient probability. In addition, the significance of this signal increases with decreasing size of the plug body.
This results in three important criteria for detecting a hammer:
1: The candle body is at the upper end of the trading period.
2: The lower shade is at least twice the size of the candle body.
3: The upper shadow is not at best in the best case, in the worst case only very small.
Hammer as a reversal figure
A single hammer candle technical analysts use to identify the moments of oversold tools. The hammer is used to confirm support and determine the moments of the trend reversal .
The psychology of the market during the formation of the figure is simply explained: a long minimum during the candle period indicates that the bears pulled the price down with a relatively large force. But as the candles formed, the bulls still pulled the price higher than the short body and the long lower candle.
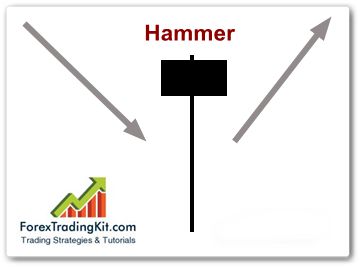
When you see a combination of a “hammer” during a downtrend, this may mean that the trend will slow and change direction, moving in lateral motion or changing to an upward trend. But remember: the hammer needs to be confirmed. Whether it means a true reversal signal will become clear from the following combination of candles.
The hammer can be either a bull or a bearish candle – Hanged. If the “hanged man” appears during the uptrend, the subtext is immediately understandable. However, you will have to wait until the next candle is formed before interpreting this signal. When / if the next candle confirms the rightness of the “hanged man”, fix all or part of the profit as the price will probably go down.
Example of Japanese Candlestick Hammer Pattern
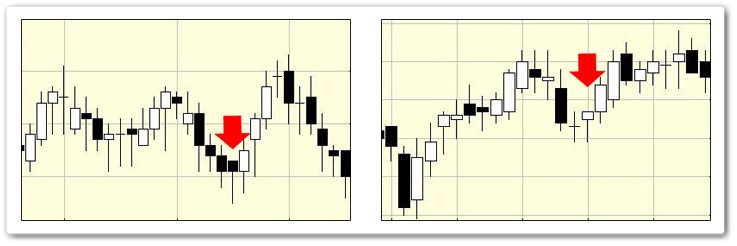
As an actual example, looking at the day-to-day foot chart of the US dollar versus the Japanese yen in the past, it can be seen that the market is changing after the hammer comes out.
Since it suggests “ceiling” if it comes out in the high price area, it can be said that it is a sign that goes downward, that is when it is sold.
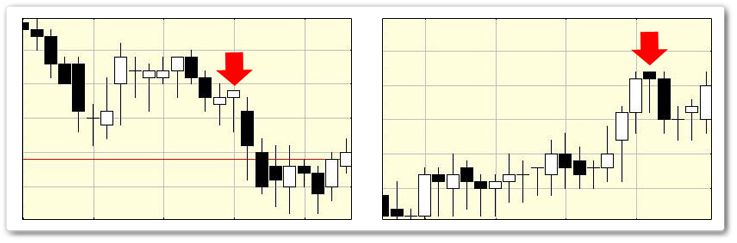
On the contrary, if it comes out in the bottom price zone, it suggests “bottom”, so it can be said that it is a sign that goes upward, that is, at the time of purchase.
Why is the hammer a reversal model?
Professional traders who are well acquainted with the analysis of candles and the psychology of the market explain this by the fact that sellers have made an attempt to significantly lower the price (this is evidenced by a long shadow down). However, buyers were able to reverse the course of events. Therefore, at the end of the hammer a small body form.
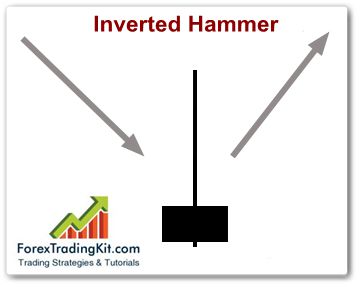
Inverted Hammer
It’s amazing that the hammer turned upside down does not change its properties for the analyst. Inverted hammer, as well as a normal hammer, is a bullish sign on the chart, while on a downtrend (otherwise, it is also called otherwise).
No matter how you divide the market periods, whether, in weeks, days or hours, the hammer is always a signal for a turnaround. Of course, the informative value increases with the height of the selected time level.