Japanese Candlestick Simple Pattern
This article explains different types of Japanese Candlestick Simple Pattern.
Japanese Candlestick Simple Pattern
Candlestick charts come from Japan and were developed in the 18th century by the legendary Muneshia Homma, one of the first and probably the most famous of all Japanese, who used the candle formations for price forecasts. Originally, candlestick charts (or candle charts) were used in the analysis of the price development of rice. With these Japanese candles, course patterns can be recognized and also serve the construction of trend lines. Steve Nison introduced these Japanese candle patterns to the Western public.
For a candle, the opening, high, low and closing price of a time unit, such as an hour, day or even week, is necessary. This course presentation approach is similar to bar charts. Bar charts are displayed as vertical lines with left and right bars representing the opening and closing price, respectively. Japanese candles, on the other hand, are represented as vertical rectangles connecting the opening and closing prices, and thin lines above and below the body, the so-called upper or lower shadow or wick (shadows or wicks).
Below are different Japanese Candlestick Simple patterns:
| S.No. | Candle Pattern Image | Candle Pattern Name | Candle Pattern Description |
| 1. | 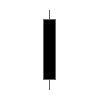 | Big Black Candle | Big Black Candle Has an unusually long black body with a wide range between high and low. Prices open near the high and close near the low. Considered a bearish pattern. |
| 2. | 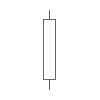 | Big White Candle | Big White Candle Has an unusually long white body with a wide range between high and low of the day. Prices open near the low and close near the high. Considered a bullish pattern. |
| 3. | 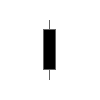 | Black Body | Black Body Formed when the opening price is higher than the closing price. Considered to be a bearish signal. |
| 4. |  | Doji | Doji Formed when opening and closing prices are virtually the same. The lengths of shadows can vary. |
| 5. |  | Dragonfly Doji | Dragonfly Doji Formed when the opening and the closing prices are at the highest of the day. If it has a longer lower shadow it signals a more bullish trend. When appearing at market bottoms it is considered to be a reversal signal. |
| 6. | 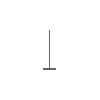 | Gravestone Doji | Gravestone Doji Formed when the opening and closing prices are at the lowest of the day. If it has a longer upper shadow it signals a bearish trend. When it appears at market top it is considered a reversal signal. |
| 7. | 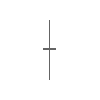 | Long-Legged Doji | Long-Legged Doji Consists of a Doji with very long upper and lower shadows. Indicates strong forces balanced in opposition. |
| 8. | 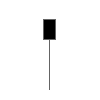 | Hanging Man | Hanging Man A black or a white candlestick that consists of a small body near the high with a little or no upper shadow and a long lower tail. The lower tail should be two or three times the height of the body. Considered a bearish pattern during an uptrend. |
| 9. | 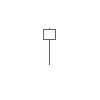 | Hammer | Hammer A black or a white candlestick that consists of a small body near the high with a little or no upper shadow and a long lower tail. Considered a bullish pattern during a downtrend. |
| 10. | 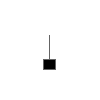 | Inverted Black Hammer | Inverted Black Hammer A black body in an upside-down hammer position. Usually considered a bottom reversal signal. |
| 11. | 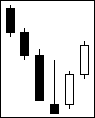 | Inverted Hammer | Inverted Hammer A black or a white candlestick in an upside-down hammer position. |
| 12. | 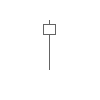 | Long Lower Shadow | Long Lower Shadow A black or a white candlestick is formed with a lower tail that has a length of 2/3 or more of the total range of the candlestick. Normally considered a bullish signal when it appears around price support levels. |
| 13. | 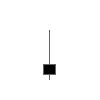 | Long Upper Shadow | Long Upper Shadow A black or a white candlestick with an upper shadow that has a length of 2/3 or more of the total range of the candlestick. Normally considered a bearish signal when it appears around price resistance levels. |
| 14. |  | Marubozu | Marubozu A long or a normal candlestick (black or white) with no shadow or tail. The high and the lows represent the opening and the closing prices. Considered a continuation pattern. |
| 15. |  | Shooting Star | Shooting Star A black or a white candlestick that has a small body, a long upper shadow and a little or no lower tail. Considered a bearish pattern in an uptrend. |
| 16. | 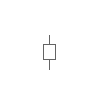 | Spinning Top | Spinning Top A black or a white candlestick with a small body. The size of shadows can vary. Interpreted as a neutral pattern but gains importance when it is part of other formations. |
| 17. | 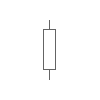 | White Body | White Body Formed when the closing price is higher than the opening price and considered a bullish signal. |
| 18. | 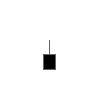 | Shaven Bottom | Shaven Bottom A black or a white candlestick with no lower tail. [Compare with Inverted Hammer.] |
| 19. |  | Shaven Head | Shaven Head A black or a white candlestick with no upper shadow. [Compared with hammer.] |