Jindal Poly Films Ltd. Technical chart | 06-Dec-2011
Below is the technical chart of Jindal Poly Films Ltd., listed on Indian stock exchnage, with ichimoku Kinko Hyo indicator.
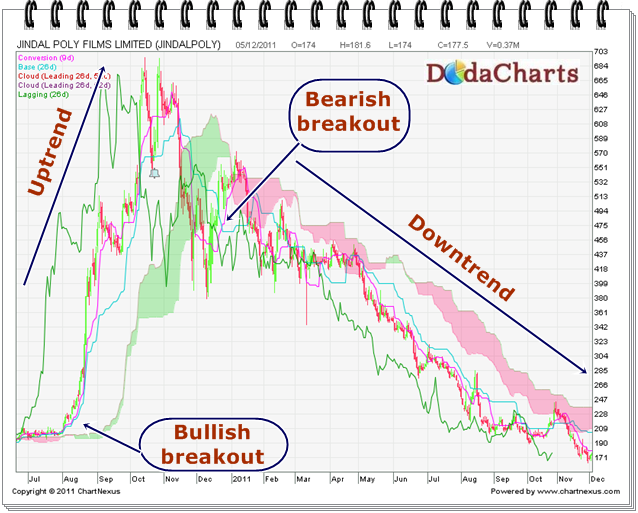
Around the end of July 2010, this stock price CLOSED above kumo @202.55, giving bullish breakout. It started its upward journet from there and touched the high of 695.
From there, it moved downward and on 19-Jan-2011, it gave bearish breakout @475.80 as it closed below kumo. It moved rapidly from there and touched the low of 164.20 on 30-Nov-2011.
This is the perfect example on importance of kumo. Price above above means that the stock is in bullish mode; price below kumo means that the stock is in bearish mode and inside kumo means that the price is in no-trade zone.
Now, the kijun-sen line is flat. So, in short term, the price can touch the level of 204.20. This is a short term trading strategy. For medium term, it should close above kumo, which is in the range of 191.70 to 204.20.